
Key Highlights
Ethereum is trading at $2,125 — down -6.60% over 30 days and -28.37% year-to-date — with a market cap of approximately $256.49 billion.
Analyst flagged a TD Sequential buy signal on ETH on May 19 — calling for a potential rebound from current levels.
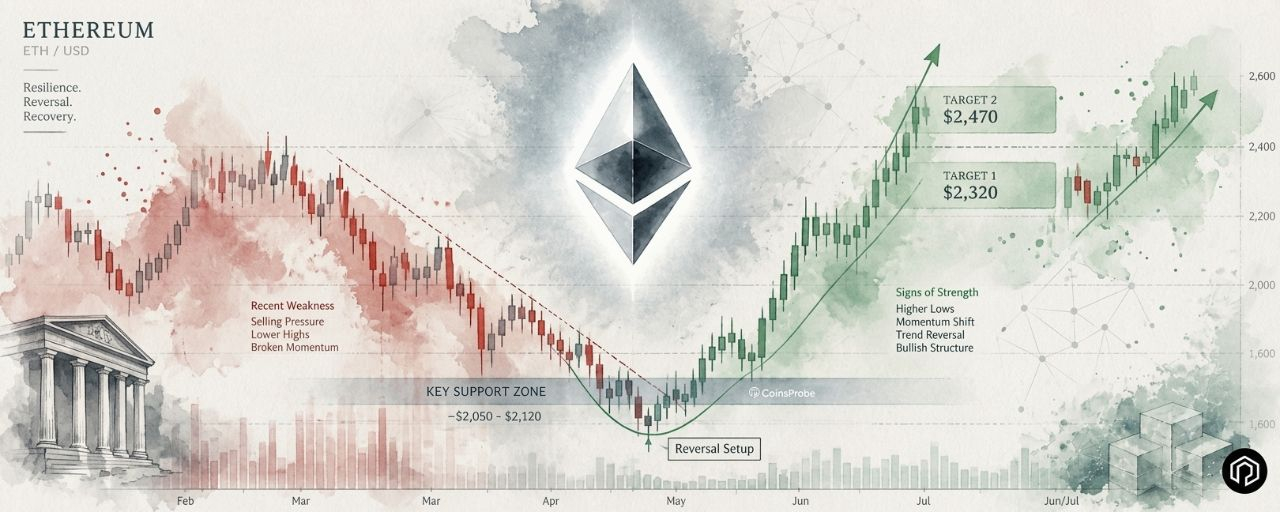
A Bullish Bat harmonic pattern has completed at point D near $2,078 on the daily chart — a high-probability reversal zone that ETH is already showing early signs of bouncing from.
Bullish targets on a confirmed pattern hold: $2,320 (0.618 Fibonacci) and $2,470 (1.0 Fibonacci). Invalidation below $2,078.
Ethereum has been under sustained pressure in 2026 — but two technical signals are now converging at the same price zone that analysts are flagging as a potential short-term reversal point. At $2,125, ETH is sitting just above a critical harmonic completion level — and with a TD Sequential buy signal firing simultaneously, the technical case for a rebound is building.
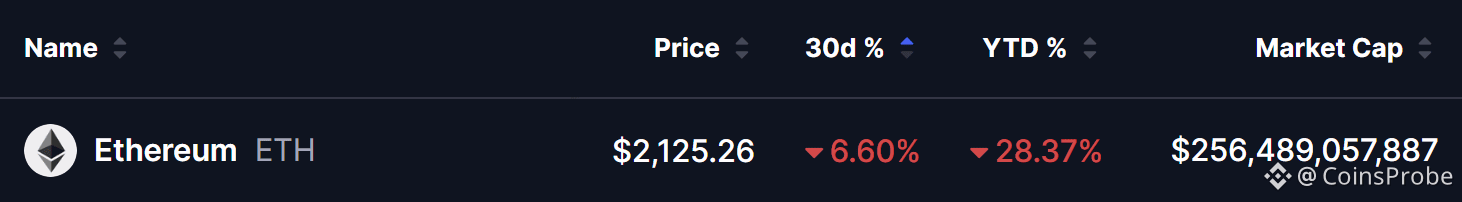 Ethereum (ETH) Price/Source: Coinmarketcap
As we covered in our Ethereum ETH/BTC fractal analysis, ETH has been building a historically significant setup on the ETH/BTC pair — testing one of the most important descending resistance trendlines since the 2017–2018 cycle. The current USD price weakness does not change the structural picture — and the two signals arriving today give bulls a specific and actionable framework to trade from.
Signal 1 — TD Sequential Buy Signal
On May 19, 2026, prominent analyst @alicharts posted a direct and clear call on ETH:
“Ethereum $ETH just got a TD Sequential buy signal. I believe a rebound could be next.”
The TD Sequential is a widely respected counter-trend timing indicator developed by Tom DeMark — designed to identify exhaustion points in a trend where selling momentum is depleting and a reversal becomes statistically more likely. A buy signal does not guarantee a rally — but it marks the point where the seller’s statistical advantage starts to erode and early buyers can begin positioning with a defined risk level.
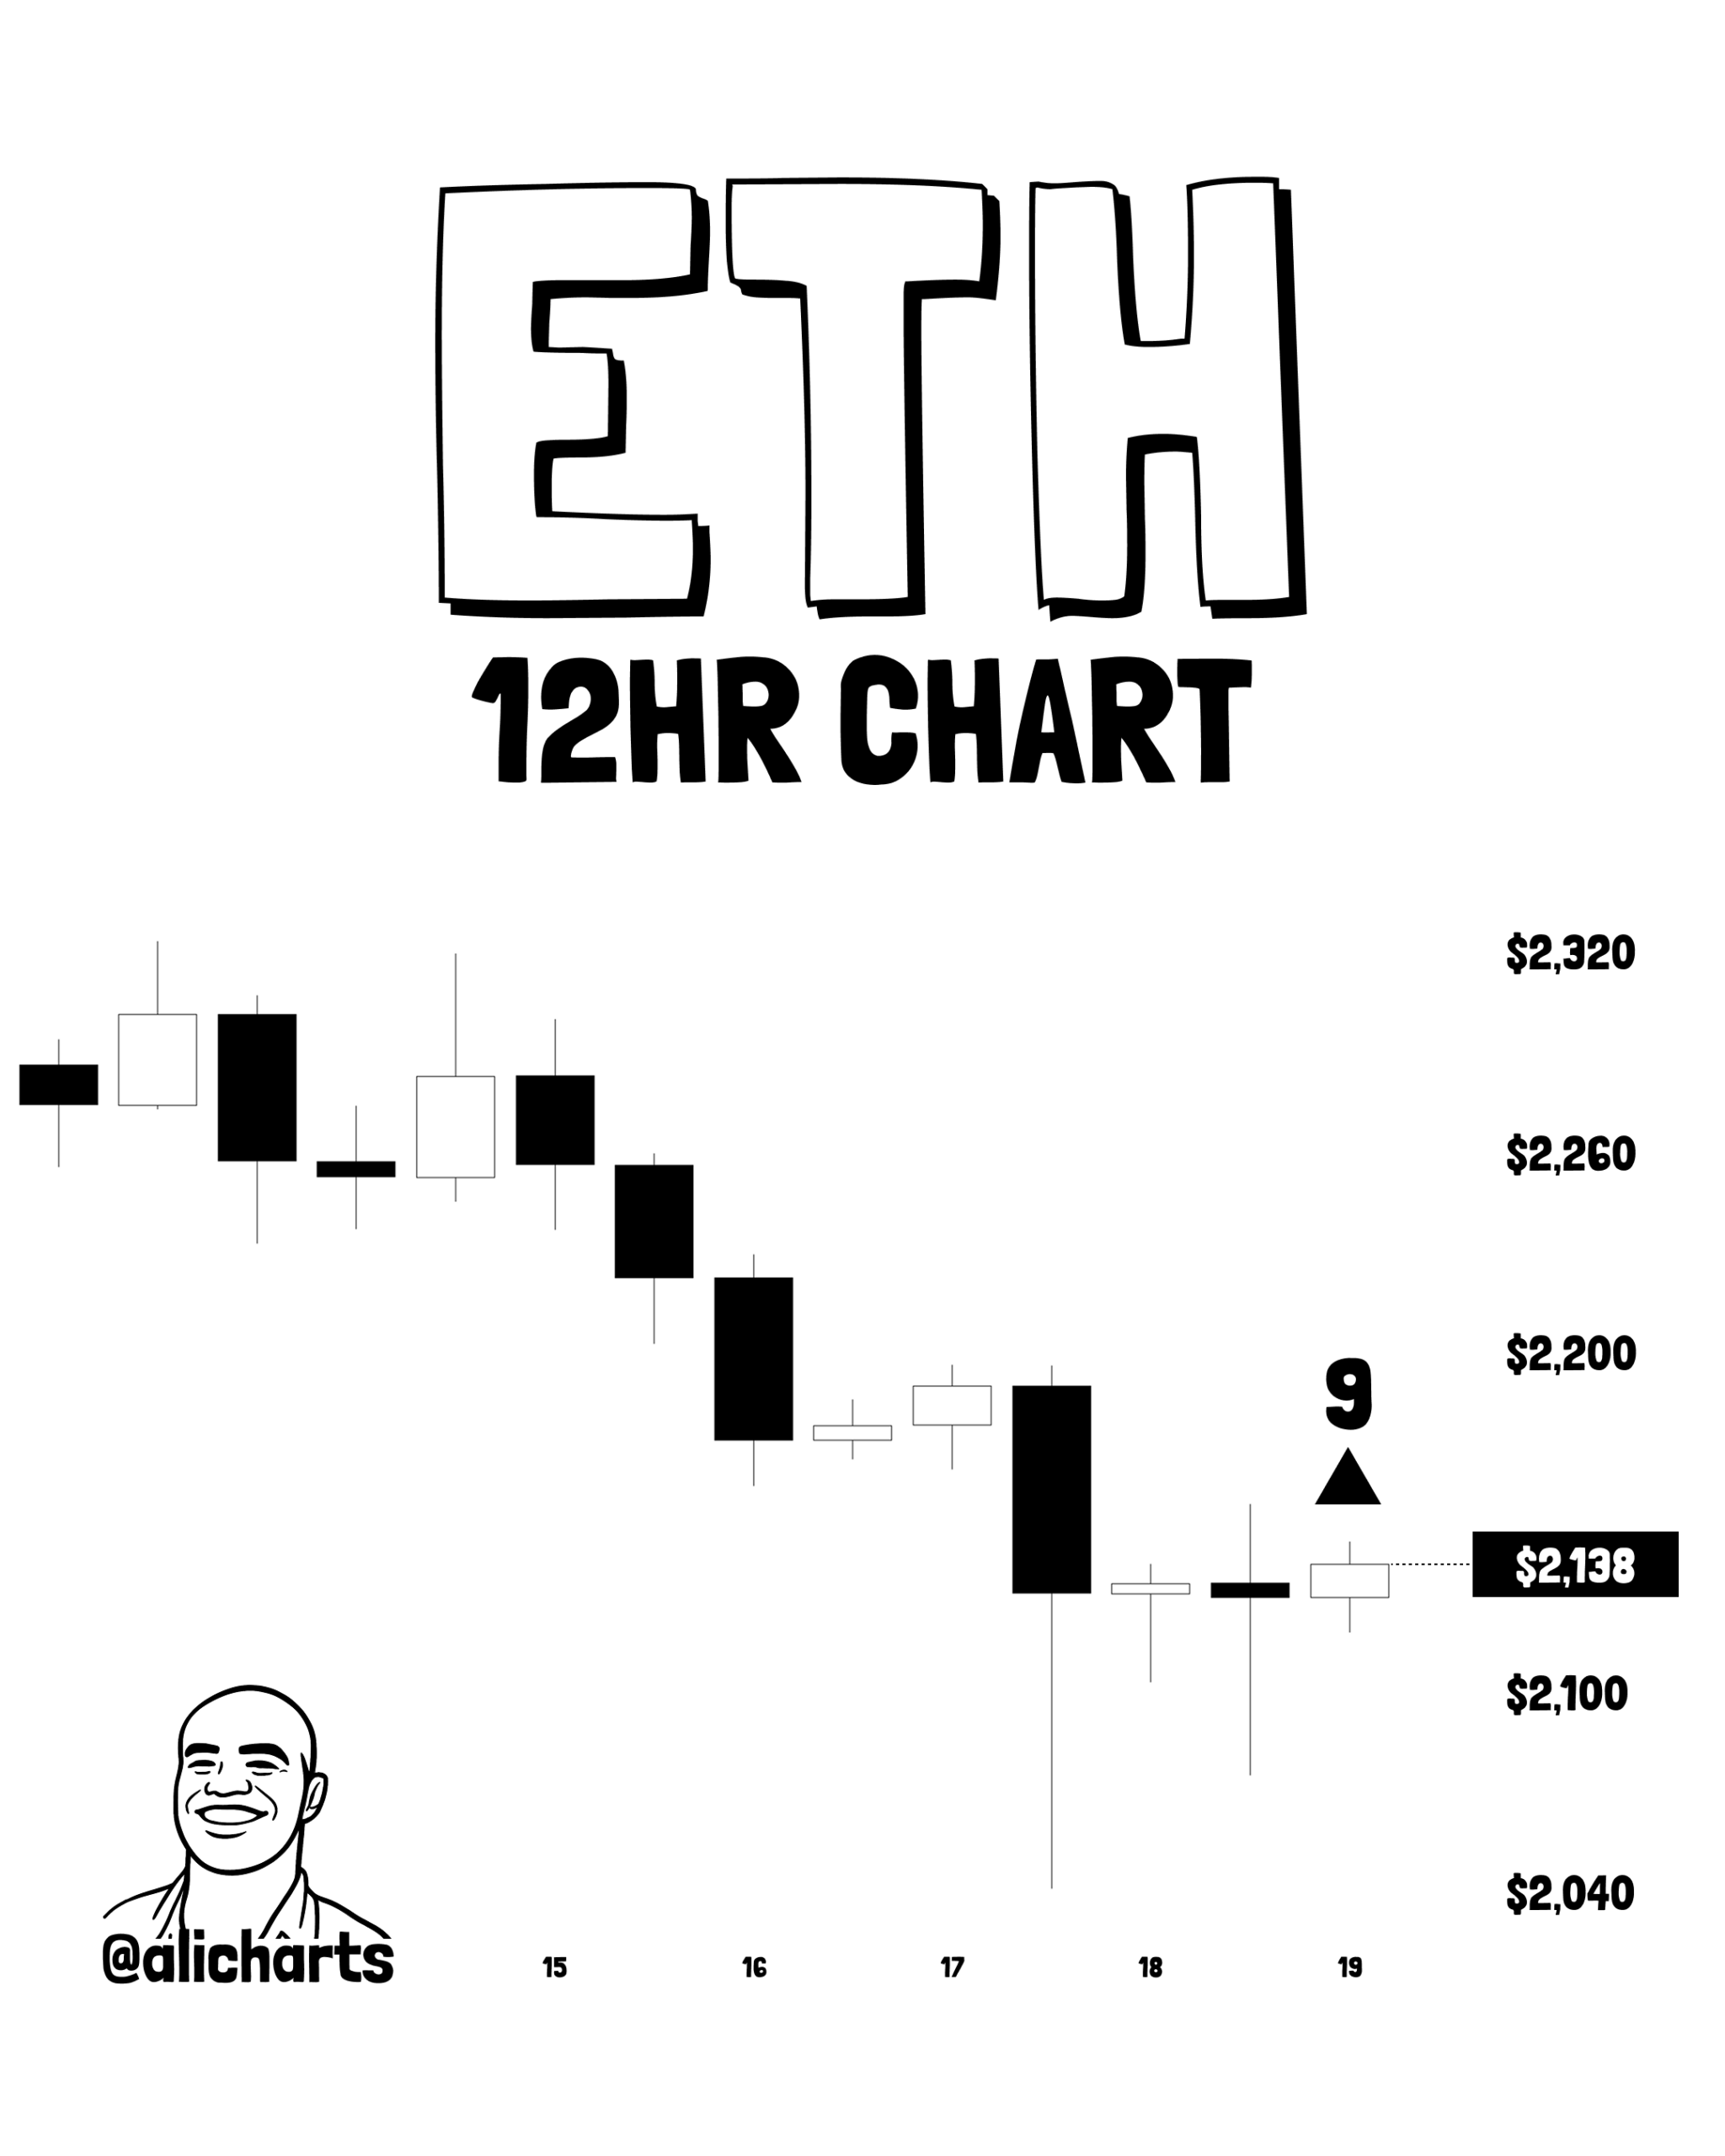 Ethereum $ETH Flashed TD Buy Signal/Source: @alicharts (X)
The signal firing at current levels — after a -28.37% year-to-date decline — is consistent with the kind of exhaustion phase where TD Sequential buy signals have historically preceded meaningful recoveries in prior ETH cycles.
Signal 2 — Bullish Bat Harmonic Pattern Completes at $2,078
The second and structurally more detailed signal is the completion of a Bullish Bat harmonic pattern on ETH’s daily futures chart — one of the most respected high-probability reversal structures in technical analysis.
According to the pattern structure:
The pattern started at point X near $2,132.
Price rallied impulsively to point A.
It then retraced to point B, rebounded to point C, and completed at point D near $2,078.
The D zone at $2,078 is the Potential Reversal Zone (PRZ) — the specific price area where the Bullish Bat pattern completes and where buyers are statistically most likely to step in against the prior corrective move. This is not a random support level — it is a Fibonacci-derived zone that aligns multiple ratio relationships from the prior swing points simultaneously.
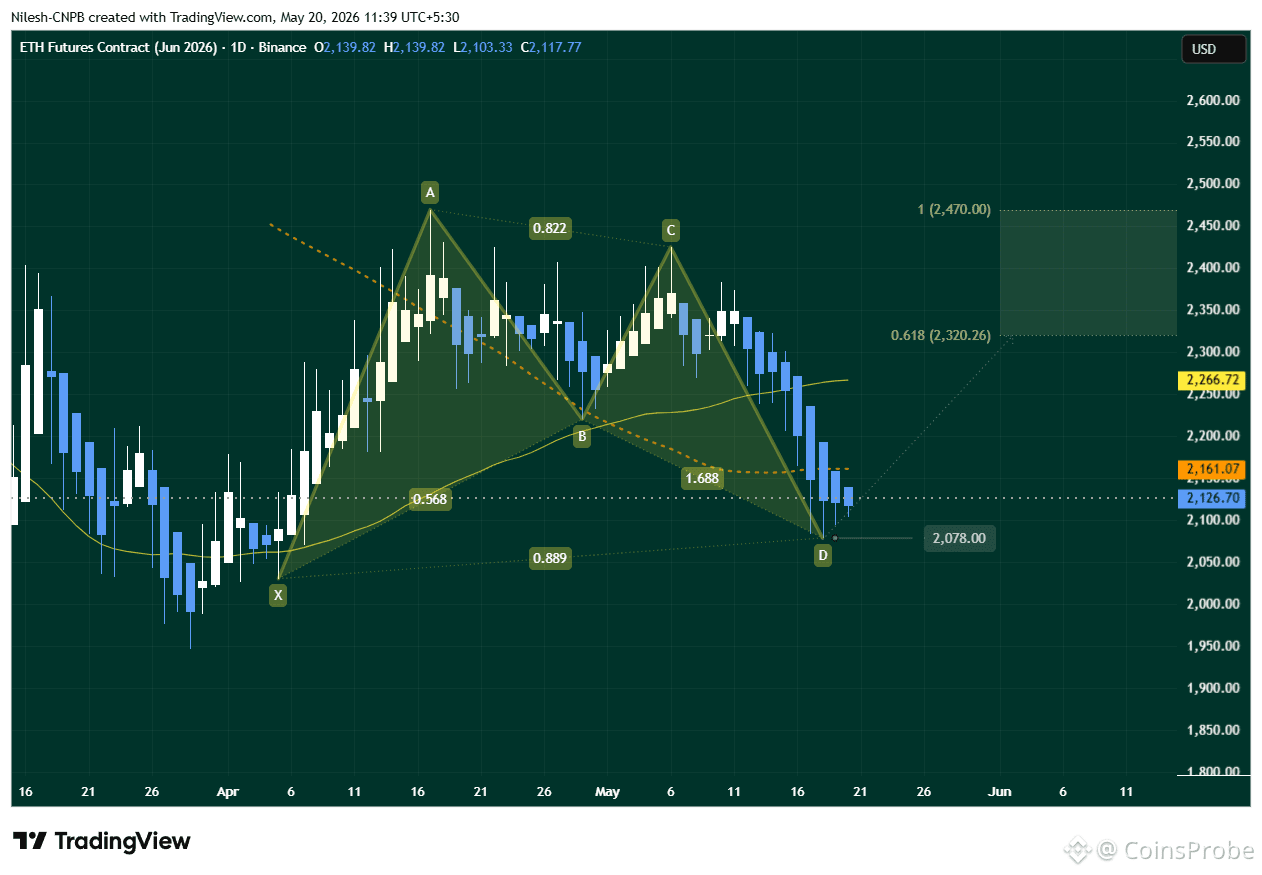 Ethereum ($ETH) Daily Chart/Coinsprobe (Source: Tradingview)
Critically, ETH has already shown an initial bounce from the $2,078 completion zone — recovering to the $2,125 current level. This early stabilisation is the first confirmation that the PRZ is attracting buyers — and it is the behaviour the pattern calls for before the larger recovery move develops.
What’s Next for ETH — Two Scenarios
Bullish Scenario
The immediate outlook depends on how price interacts with the $2,078 support zone. A sustained hold above this level, followed by a decisive break higher, would validate the harmonic pattern. In that case, the next upside targets align with key Fibonacci extensions at $2,320 (0.618 level) and $2,470 (1.0 level).
Bearish Scenario
A decisive daily close below $2,078 invalidates the Bullish Bat pattern entirely — signalling that the PRZ has failed to hold and sellers remain in control. In this scenario the harmonic setup is negated and lower support levels would need to be identified. The broader context — a -28.37% year-to-date decline and continued macro headwinds — means a pattern failure here could accelerate the downside rather than simply delay the recovery.
Bottom Line
Ethereum’s technical picture is offering two simultaneous signals that bulls will be watching closely — a TD Sequential buy signal from @alicharts and a Bullish Bat harmonic pattern completion at $2,078. The early bounce from the PRZ zone is encouraging. But confirmation requires a sustained hold above $2,078 on a daily closing basis — anything less and the pattern remains at risk.
Watch $2,078 as the floor. A hold opens the path to $2,320 and $2,470. A break below puts the harmonic setup off the table.
Disclaimer: The views and analysis presented in this article are for informational purposes only and reflect the author’s perspective, not financial advice. Technical patterns and indicators discussed are subject to market volatility and may or may not yield the anticipated results. Investors are advised to exercise caution, conduct independent research, and make decisions aligned with their individual risk tolerance.