The cryptocurrency market is showing significant structural developments as Bitcoin (BTC/USDT) consolidates within a well-defined multi-month range. By analyzing the 1-Day (1D) chart on Binance and utilizing advanced volume metrics, specifically the Volume Profile Visible Range (VPVR), we can decode institutional footprints, identify massive liquidity nodes, and map out the next high-probability macro movements.
1. Volume Profile Metrics: Identifying Key Structural Levels
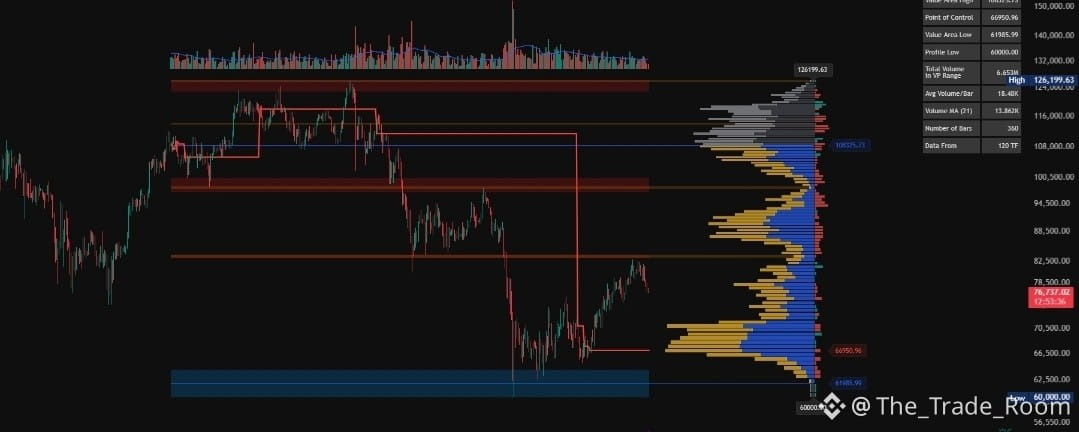
The Volume Profile on the right side of the chart provides a clear picture of where the highest amount of trading activity has taken place over the specified historical period. Unlike standard time-based volume, price-based volume highlights undeniable support and resistance zones.
Point of Control (POC) [$66,950.96]: This is the single highest volume node on the chart (red line), representing the fairest price where institutions and retail traders conducted the maximum amount of business. It serves as the ultimate macro support baseline.
Value Area Low (VAL) [$61,985.99]: This forms the lower boundary of the value area (where 70% of the volume was traded). The massive demand block highlighted in blue between $60,000.00 and $62,500.00 marks the absolute macro bottom and an ironclad accumulation zone.
Value Area High (VAH) [$108,325.73]: The upper boundary of the heavy trading volume zone. A sustained breakout above the current consolidation phase opens the door directly toward this six-figure milestone.
Profile High [$126,199.63]: The ultimate historical peak visible in the current range, which acts as the major long-term upside target once the current structures break.
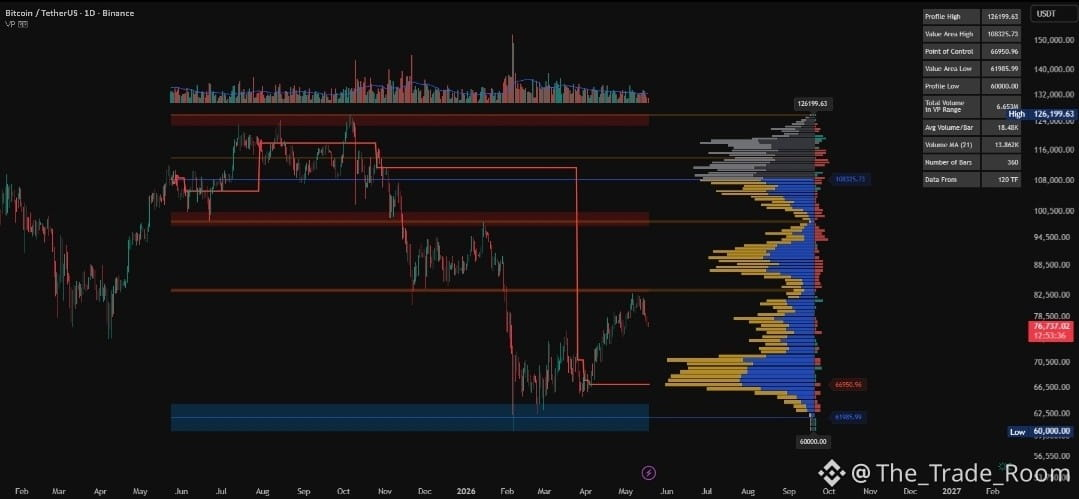
2. Current Price Action & Trend Analysis
Bitcoin is currently trading at $76,737.02, displaying a strong recovery after testing the deep liquidity pool near the POC and VAL earlier this year.
The Liquidity Sweep & Reversal: In early 2026, BTC experienced a healthy correction, sweeping the liquidity all the way down to the $60,000 - $66,000 demand zone. This area perfectly aligns with the high-volume nodes of the Volume Profile, indicating strong institutional defense.
The Ascending Structure: Since February, the price action has been printing higher lows, slowly building bullish momentum. The market has successfully claimed the POC ($66,950.96) as solid structural support and is now pushing into the lower-volume gaps.