The gold market is currently sitting at a critical crossroads as we head into the market opening on Monday. While geopolitical headlines are shifting rapidly, the technical charts and cyclical indicators point toward a very structured path.
Here is a comprehensive breakdown of the key levels, the impact of the latest geopolitical news, and the upcoming cosmic cycles that traders must watch.
1. Geopolitical Catalyst:
Over the weekend, a massive headline emerged with President Donald Trump announcing a "near-final peace deal with Iran after months of war." Historically, peace agreements and the easing of conflicts (including the planned reopening of the vital Strait of Hormuz shipping lane) act as a bearish trigger for gold, as the global "safe-haven" premium shrinks.
The headline over the weekend regarding President Donald Trump’s near-final peace deal with Iran is triggering a massive domino effect across global markets:
The Oil Dump: With the vital Strait of Hormuz shipping lane set to reopen, the market is bracing for an immediate plunge in crude oil prices due to restored supply lines.
Tamed Inflation: A sharp drop in energy costs directly implies that global inflationary pressures will finally be brought under control.
The Fed Rate Cut Pivot: Controlled inflation gives the Federal Reserve the perfect green light to aggressively pursue an expected rate cut.
Because gold thrives in a lower interest rate environment, this sudden surge in Fed rate cut bets is expected to ignite aggressive panic buying as soon as the market opens on Monday.
However, market openings after major weekend news often spark panic buying or short-term volatility due to initial liquidity gaps and algorithmic reactions. Traders should expect a bumpy ride or a temporary spike during the early Monday session as retail participants digest the news before the fundamental reality kicks in.
2. Technical Roadmap: Key Levels to Watch
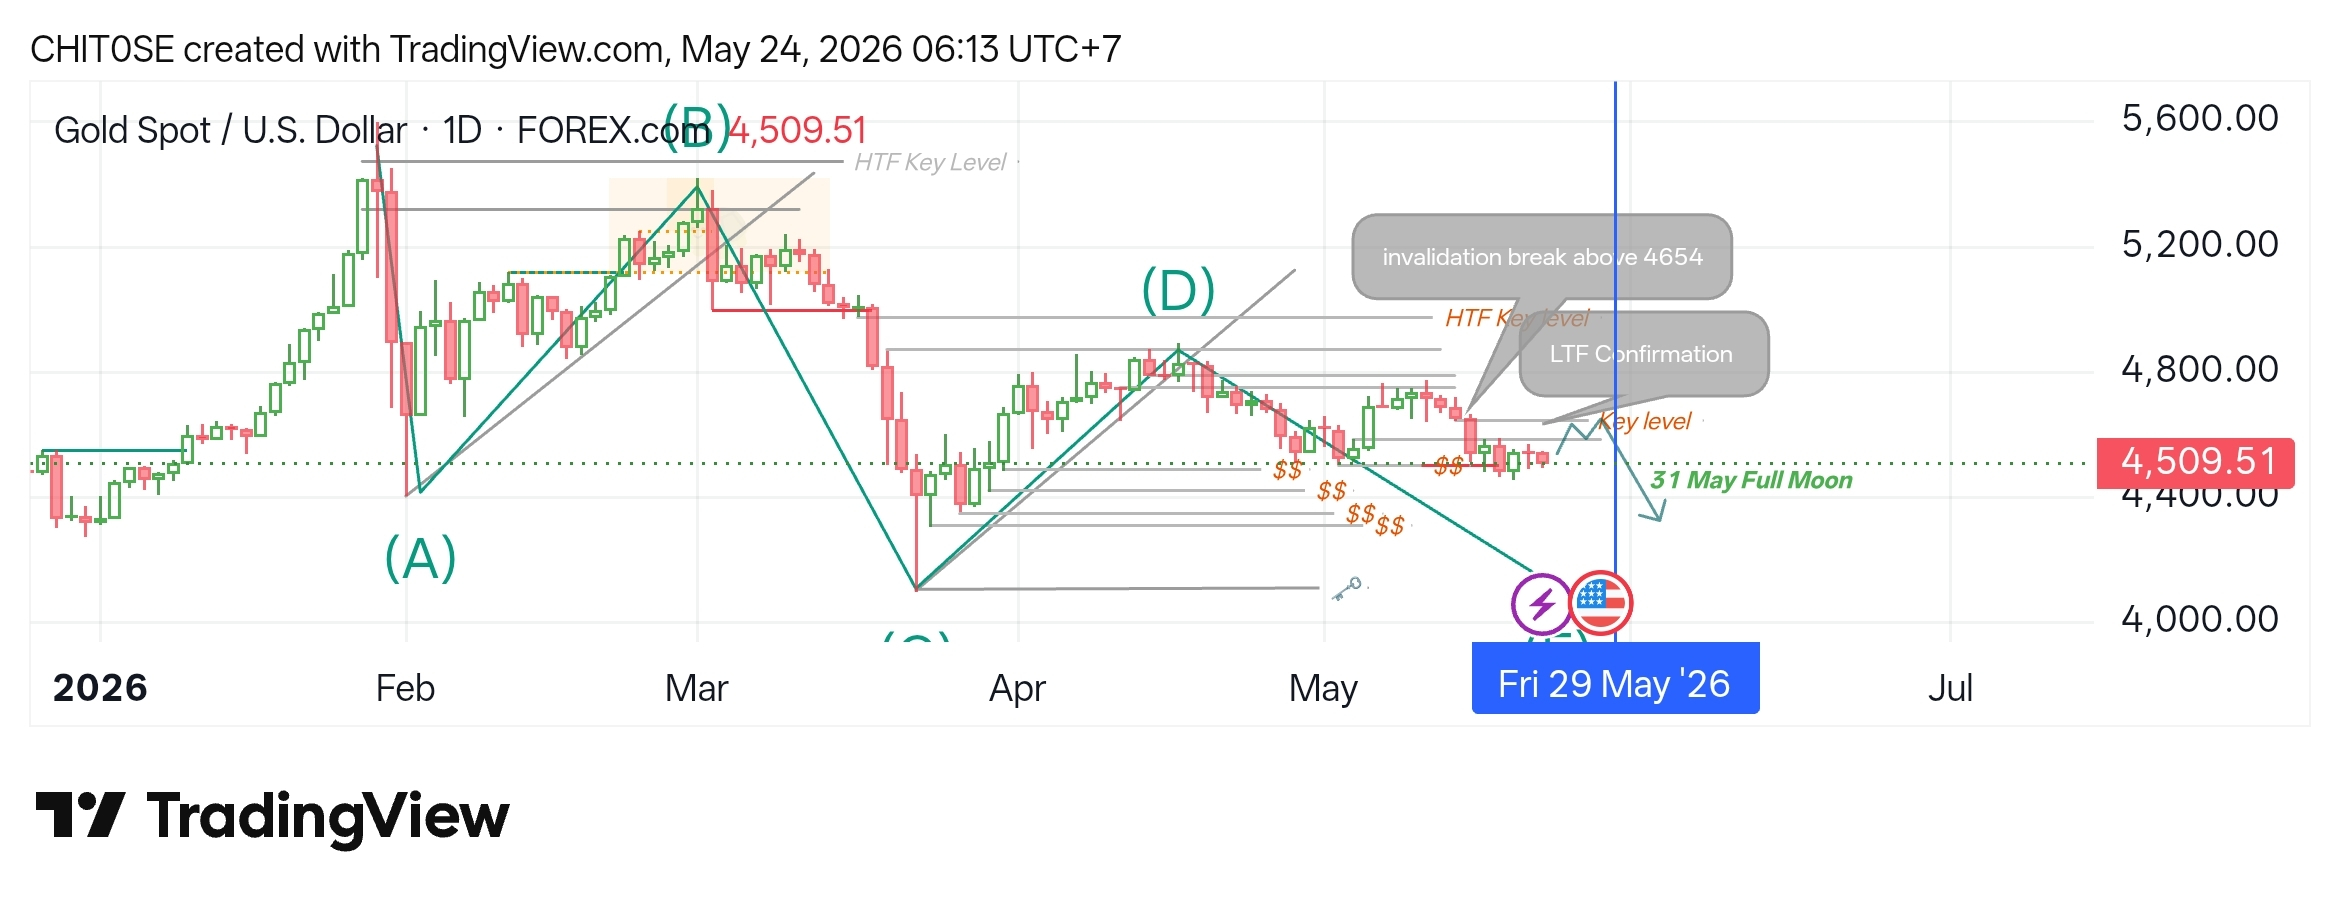
Looking at the Daily (1D) chart, Gold is currently trading around $4,509.51. The structural pattern forms a clear corrective wave progression (A-B-C-D-E), and the technical bias remains heavily in favor of the bears, provided certain price levels are respected:
The Invalidation Level (4,654): As marked on the chart, an "invalidation break above 4,654" is the ultimate line in the sand for sellers. If the price manages to break and hold above this High-Time-Frame (HTF) level, the current bearish thesis is completely invalidated.
Low-Time-Frame (LTF) Confirmation: The price is testing local resistance. A failure to clear this key level confirms that institutional supply is still dominant.
The Trend Bias: As long as these resistance keys hold firm against Monday’s initial volatility, the broader market trend shows a heavy bearish continuation tendency.
3. The Astrological Factor: The 31 May Full Moon Weekend Effect
Financial astrology and time-cycle analysis have long been utilized by veteran commodities traders to spot pivotal trend reversals. The chart explicitly highlights the upcoming 31 May Full Moon.
Because May 31 falls on a Sunday when the traditional market is closed, traders must look at the H-1 and H+1 window (before/after) to capture the real impact of this cycle. This means the market is highly likely to react during:
Friday, May 29 (Pre-Moon Cycle Liquidity Sweep): Where institutional positioning or profit-taking occurs.
Monday, June 1 (Post-Moon Cycle Momentum): Where the full force of the cycle manifests upon the market reopen.
With the current technical trajectory sloping downwards, this weekend Full Moon heavily suggests a major liquidity flush or the acceleration toward lower support targets right around these specific dates.
Summary Strategy for Traders
Don't let the Monday morning opening noise blindside you. While the Trump peace announcement might cause erratic, knee-jerk panic buying initially, the structural technicals indicate that rallies are meant to be faded.
Trading Rule: Watch the 4,654 invalidation level closely. As long as the price stays underneath this barrier, expect the bearish momentum to carry Gold lower, with the volatility peaking around the May 29 (Friday) to June 1 (Monday) Full Moon window. Stay disciplined and manage your risk!