
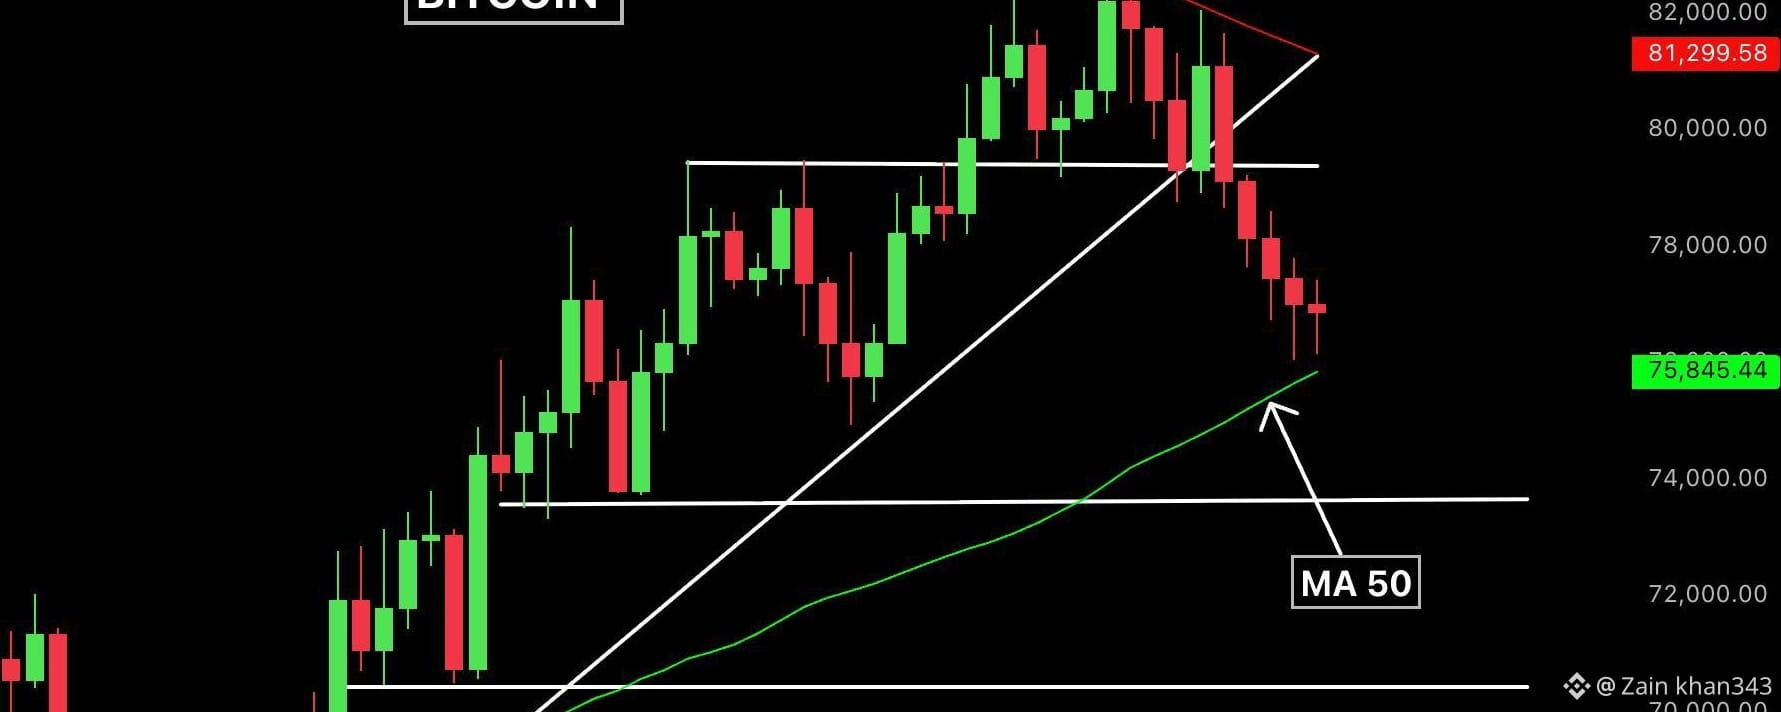
Bitcoin Daily Chart is showing weakness.
Got rejected at the 200-day MA and now testing support at $78,000.
A break below $78,000 could open the door to $73,500 and then $70,000.
On the Weekly Chart:
Bitcoin looks like it has broken out of a long-term falling trendline, with bullish MACD and RSI.
However, the real move won’t start until Bitcoin begins moving on its own strength instead of riding Nasdaq’s coattails.