
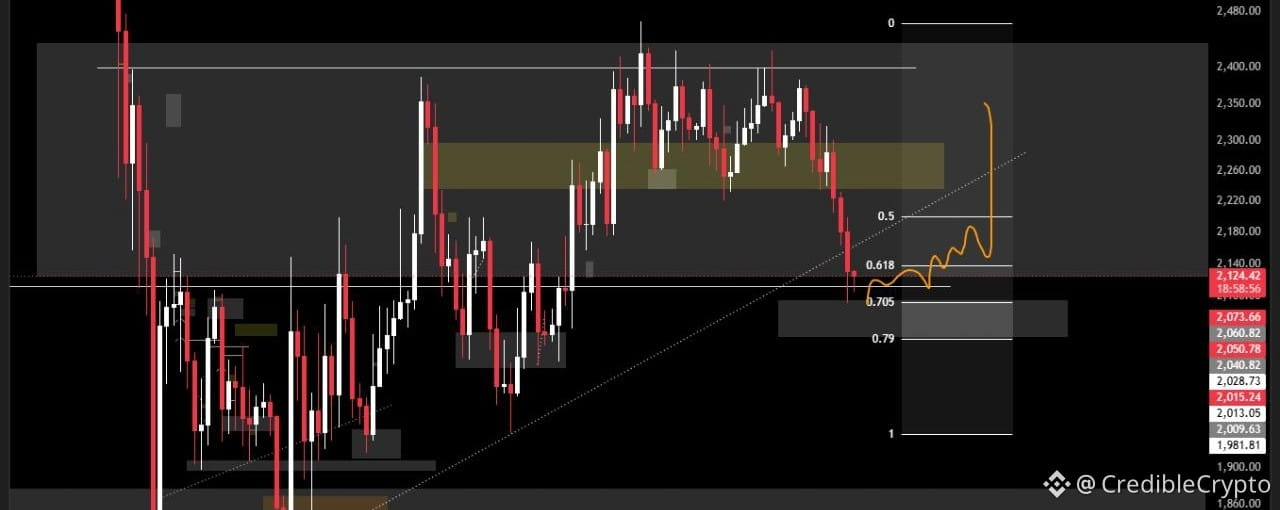
1. Big drop in Feb: ETH tanked hard from ∼$2,700 down to ∼$1,750. That’s the long red candle on the left.
2. Recovery phase: From Feb to mid-May it bounced around in a range, mostly between $2,000 and $2,400. You can see it kept rejecting at the top of that gray box around $2,400.
3. Pullback now: Since mid-May it’s been sliding down again and just hit ∼$2,124. The price is sitting right on a rising trendline that’s been holding since February.
What the chart is highlighting
- The gray boxes: These are “support/resistance zones” — areas where price has reversed before. The big one at $2,000-$2,400 is the main battleground.
- The numbers 0.618, 0.705, 0.79: Those are Fibonacci retracement levels. Traders use them to guess where a pullback might stop. Right now ETH is sitting just above the 0.618 level at $2,124.
- The orange squiggly line: That’s a potential path someone drew. It shows a dip down to ∼$2,050-$2,000, then a bounce and breakout up toward $2,350+ in June. It’s not guaranteed, just one idea.
The human version of what this means
ETH got rejected at the top of its range and is now testing the lower end + a key trendline.
- If $2,000-$2,050 holds: That’s been support before. A bounce from here would line up with the orange line — meaning ETH could rally back toward $2,300-$2,400.
- If it breaks below $2,000: The next real support is down around $1,860-$1,900. That would mean more pain and the uptrend from Feb would be in trouble.
So basically, ETH is at a “make or break” spot right now. The next few daily candles will tell you if buyers step in at $2,000 or if sellers take it lower.
Want me to break down what to watch for on the next candle so you know if it’s a real bounce or a fakeout?