
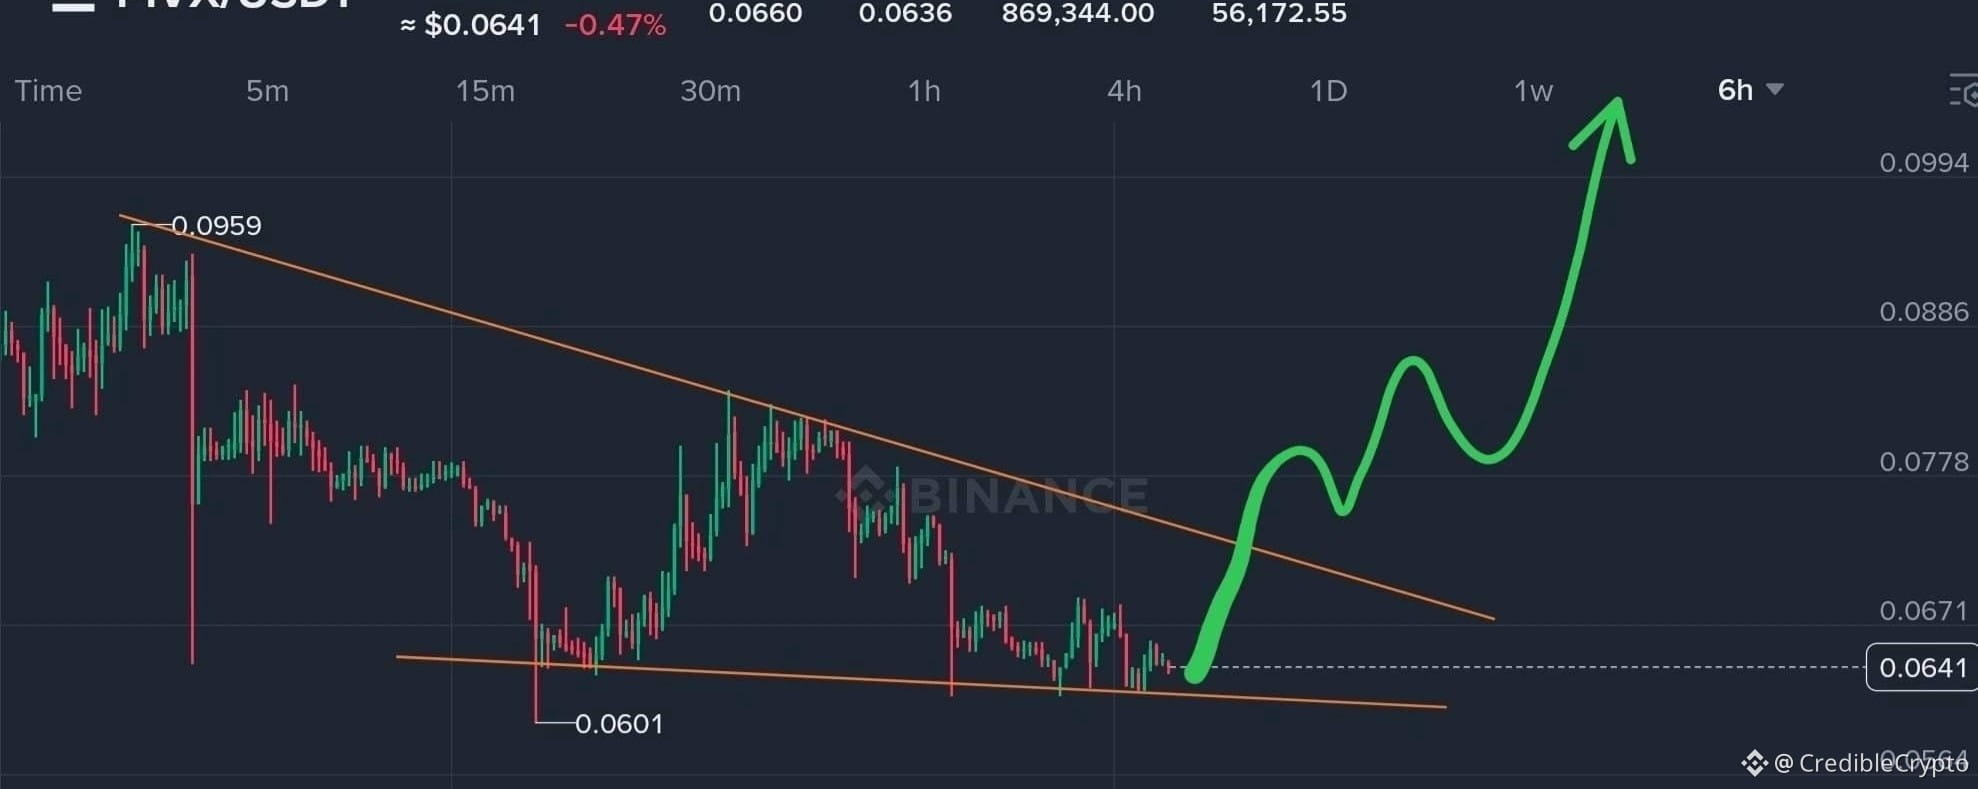
$PIVX PIVX/USDT Approaches Key Technical Breakout After Extended Consolidation
The PIVX/USDT pair on Binance is sitting at a technically significant level, with price action compressed inside a descending triangle pattern that’s been forming for several weeks. As of the chart snapshot, PIVX trades at $0.0641, down 0.47% over the last 24 hours.
The Setup: Descending Triangle Nearing Resolution
Looking at the 6-hour timeframe, PIVX has been making lower highs along a descending trendline while finding support around $0.0601. This structure forms a classic descending triangle, typically a continuation pattern. The lower boundary has been tested twice, with the most recent low at $0.0601, showing buyers are defending that zone.
Volume has tapered as the price coils tighter between the two trendlines. The 24h volume sits at 869,344 PIVX, equivalent to $56,172.55 USDT. The 24h range has been tight too, moving between $0.0636 and $0.0660.
What the Chart Projection Suggests
The annotated green line shows a breakout scenario. If price breaks above the descending trendline near $0.0670-$0.0675 with volume, the measured move would target the next resistance levels at $0.0778, $0.0886, and potentially $0.0994. That would represent roughly a 20-55% move from the current $0.0641 level.
Breakouts from descending triangles often see accelerated moves once price closes above the upper trendline and flips it into support. The key here is a clean break with sustained volume, not a wick and rejection.
Key Levels to Watch
Support: $0.0601 remains the critical level. A daily close below this would invalidate the current structure and open risk toward $0.0564.
Resistance: The immediate hurdle is the descending trendline around $0.0670. Above that, $0.0778 is the next major supply zone based on prior price action.
Current Price: $0.0641, trading just above the triangle’s lower boundary and testing the patience of both bulls and bears.
The Bigger Picture
PIVX has been in a downtrend since the high near $0.0959, but the contracting range suggests that selling pressure is exhausting. Triangles don’t last forever, and with price now at the apex, a directional move is likely soon.
A breakout would shift market structure bullish on the higher timeframe, while a breakdown would keep the bearish trend intact. Traders watching this pair are likely waiting for a close outside the triangle before committing.
---