
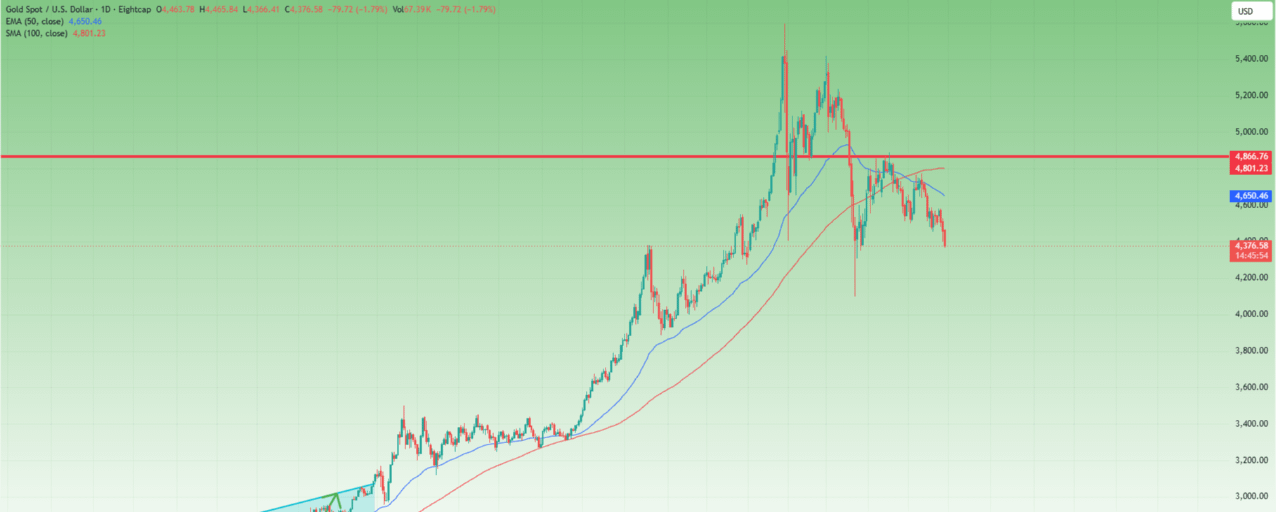
Yesterday, after almost 10 frustrating days of range trading, Gold finally delivered what many traders were waiting for:
a genuine break below the extremely important 4500 figure.
And once the level gave up properly, what followed was something very familiar for anyone with real market experience:
➡️ acceleration.
The market didn’t simply drift lower.
It collapsed more than 1000 pips.
And honestly, from a technical perspective, this move looked almost like the chronicle of an announced drop.
Because the warning signs were there for quite some time.
Let’s look at them objectively:
Since the January all-time high, Gold has been forming a clear sequence of lower highs
The recovery from the March 4100 low was overlapping and corrective in nature
Every major rebound stopped directly into resistance instead of expanding impulsively
After the first aggressive leg down from 4900 to 4500, bulls failed completely to regain control
Gold then formed yet another lower high
And the final structure before the breakdown was marked by two powerful bearish engulfing candles — one last week and another again this Tuesday
When multiple technical elements start aligning in the same direction, markets tend to eventually react violently.
And that is exactly what happened.
But More Important Than Yesterday’s Drop Is What Could Come Next
In my opinion, the downside move in Gold is far from over from a medium-term perspective.
And here I really want to emphasize something important for traders who still struggle to understand how trends actually work:
Just because the market rises for a few hours or even a few days does NOT automatically make it bullish.
Inside bearish trends, corrections exist.
Violent corrections exist.
Even emotional rallies exist.
But a correction inside a bearish trend is still… a correction inside a bearish trend.
And at this moment, the broader bearish structure remains fully intact.
The sequence discussed above did not disappear because Gold bounced a few hundred pips.
In fact, yesterday’s downside break reinforced the bearish perspective even more.
Another Important Detail Most Traders Ignore
Although I normally do not use moving averages heavily in my analyses, in this case there is something worth mentioning.
Gold is now trading clearly below the 50 SMA and also below the 100 SMA for traders who monitor longer-term momentum.
But the really important detail is this:
For the first time since 2022, the 50 SMA itself has started turning downward.
And that matters because moving averages do not predict direction — they reflect structural momentum.
When even medium-term momentum indicators start rolling over after years of bullish structure, it usually signals that something bigger may be changing underneath the surface.
Trading Perspective Going Forward
From a swing trading perspective, I continue to believe that searching for selling opportunities near resistance zones remains the correct approach.
At this stage:
4500 becomes major resistance again
rallies should be treated cautiously
and bearish continuation remains, in my opinion, the higher probability scenario
With the previously discussed 4360 support already touched, the next important downside target becomes the 4250 zone.
And to be very clear:
I am not changing my bearish view unless we see a strong reversal and sustained recovery back above 4500.
Until then, for me, the path of least resistance remains lower 🚀
#xauusd #PostonTradFi