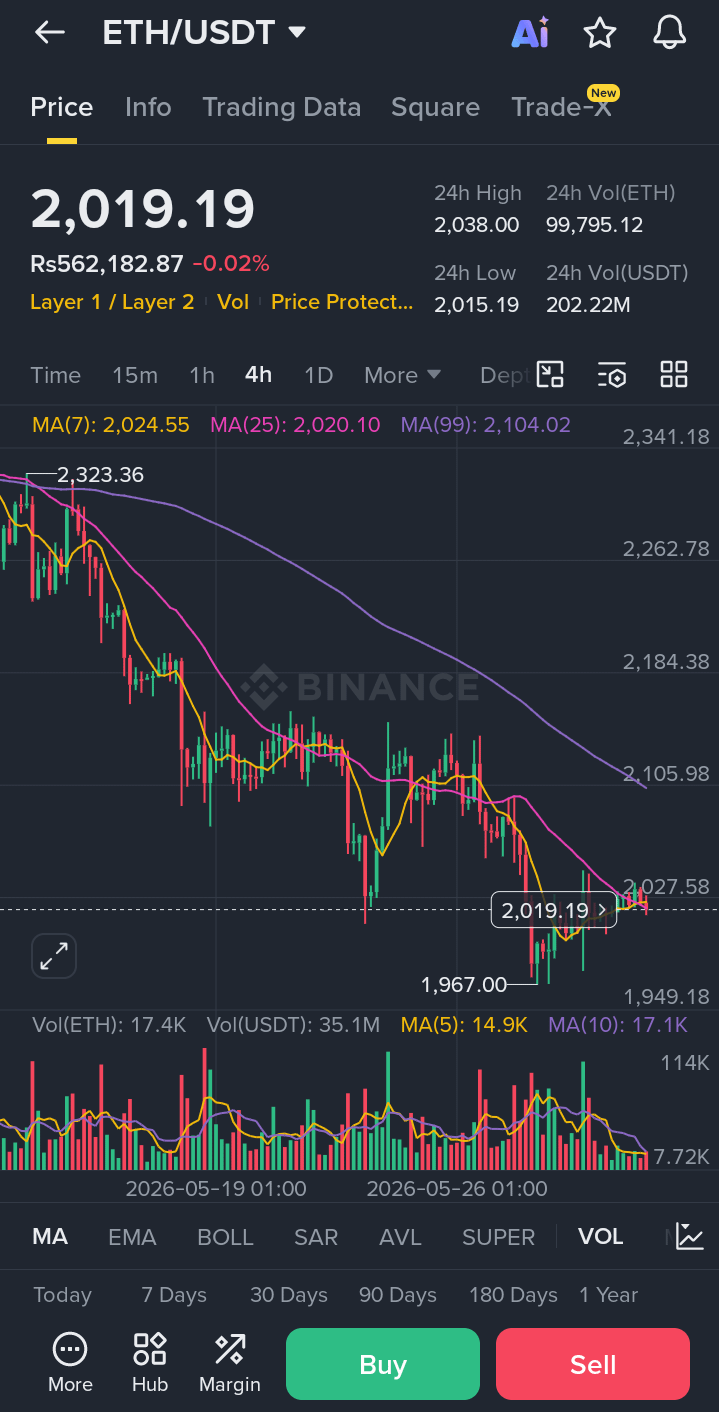
The Ethereum ($ETH ) market is flashing critical signals on the 4-hour chart. After a prolonged downtrend from the $2,323 levels, $ETH is currently battling to establish a solid floor around the $2,019 mark.
Let’s break down what the technical indicators are telling us and what to watch next.
🔍 Key Technical Breakdown
Price Action & Support: ETH recently hit a local low of $1,967.00, where buyers stepped in to push the price back above the psychological $2,000 barrier.
Moving Averages (MA) Resistance: * The MA(7) (Yellow) is sitting at 2,024.55.
The MA(25) (Pink) is just above at 2,020.10.
The price is currently trapped just below these short-term MAs. A clean breakout and candle close above $2,025 is required to kickstart a short-term bullish reversal.
The MA(99) (Purple) at 2,104.02 remains the heavy macro resistance line for any major trend reversal.
Volume (VOL): Volume is showing a slight consolidation pattern, indicating that traders are waiting for a decisive breakout before putting heavy capital to work.
🔮 Potential Scenarios to Watch
🟢 The Bullish Case (Reversal)
If $ETH can flip the $2,025 resistance (MA 7 & 25) into support, we could see a quick relief rally targeting the $2,105 zone (MA 99). Clearing that could re-open the doors for a move back toward $2,184.
🔴 The Bearish Case (Continuation)
Failure to break above the immediate MA resistance could result in another retest of the recent $1,967 low. If that support breaks, the next major downside target rests around the $1,949 liquidity pool.
💡 Trader's Verdict
Ethereum is in a tight accumulation/decision zone. Risk management is crucial here. Wait for a confirmed 4-hour candle close above the MAs for a long trigger, or look for short opportunities if the $1,967 level breaks down with high volume.
What’s your move? Are you buying the dip or waiting for lower prices? 👇
#Ethereum #CryptoTrading. #TechnicalAnalysis #ETHUSDT #CryptoMarket