Current Market Snapshot
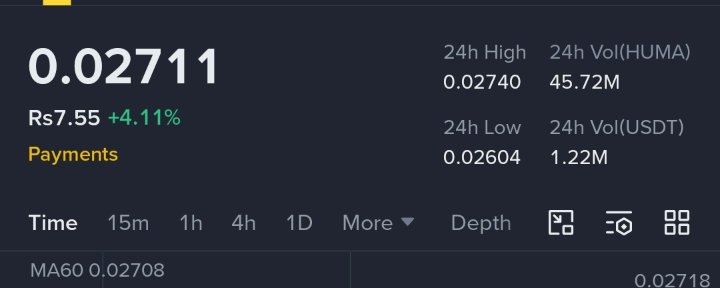
The HUMA/USDT pair is currently trading around $0.02711, showing a +4.11% daily gain. The chart indicates short-term bullish momentum after recent volatility, with buyers attempting to defend the 0.0260 support zone.
Key Statistics
Current Price: $0.02711
24H High: $0.02740
24H Low: $0.02604
24H Volume (HUMA): 45.72M
Daily Performance: +4.11%
The recent increase in volume suggests renewed trader interest, especially after the pair bounced from intraday lows.
---
Technical Analysis
1. Short-Term Trend
On the 15-minute timeframe, HUMA is showing:
Gradual upward recovery
Higher buying pressure near support
Stabilization above the MA60 level
The price attempted multiple pushes toward the 0.02715–0.02718 resistance area, but sellers are still active there.
Bullish Signals
Strong rebound from 0.0260
Positive daily momentum
Increasing trading volume
Buyers defending support zones aggressively
Bearish Signals
Resistance remains strong near 0.0274
Short-term chart still volatile
Volume spikes accompanied by red candles indicate profit-taking
---
Important Price Levels
Support Zones
Primary Support: 0.0260
Secondary Support: 0.0255
If price falls below these levels, bearish pressure could intensify.
Resistance Zones
Immediate Resistance: 0.0274
Major Resistance: 0.0280–0.0290
A breakout above 0.0274 with strong volume may open the door for another upward rally.
---
Momentum & Volume Analysis
The volume section shows increased activity during recent candles, which often indicates:
Institutional or whale participation
Short-term speculative trading
Momentum-driven buying
However, volatility remains high, meaning traders should expect sharp moves in both directions.
---
Performance Outlook
Positive Long-Term Metrics
7 Days: +7.28%
30 Days: +22.50%
90 Days: +115.84%
These numbers suggest HUMA has delivered strong medium-term growth despite recent corrections.
Concern Areas
180 Days: -2.66%
1 Year: -26.29%
This indicates the project is still recovering from longer-term market weakness.
---
Market Sentiment
Current sentiment appears cautiously bullish:
Traders are accumulating near support
Momentum is improving
Short-term buyers dominate the market
But the coin still needs:
Stronger breakout confirmation
Sustained volume
Broader crypto market support
Without these factors, rallies may remain temporary.
---
Possible Scenarios
Bullish Scenario
If HUMA breaks above 0.0274, targets could include:
0.0280
0.0295
0.0310
Bearish Scenario
If support at 0.0260 fails:
Price could revisit 0.0250
Panic selling may increase short-term volatility
---
Final Analysis
HUMA/USDT is currently in a recovery phase with improving short-term momentum. The coin shows signs of buyer strength after defending key support levels, but resistance overhead remains significant. Traders should watch volume carefully because any breakout or rejection around the current zone may determine the next major move.
At present:
Short-term outlook: Bullish to neutral
Medium-term outlook: Positive recovery trend
Risk level: High volatility
For active traders, the 0.0274 resistance and 0.0260 support are the most important levels to monitor over the next sessions