BNB/USDT Technical Analysis: Bullish Breakout Confirmed? 🚀
BNB is showing strong bullish signs on the daily chart after completing a classic Inverse Head & Shoulders pattern! Here is a quick breakdown of what the chart is telling us:
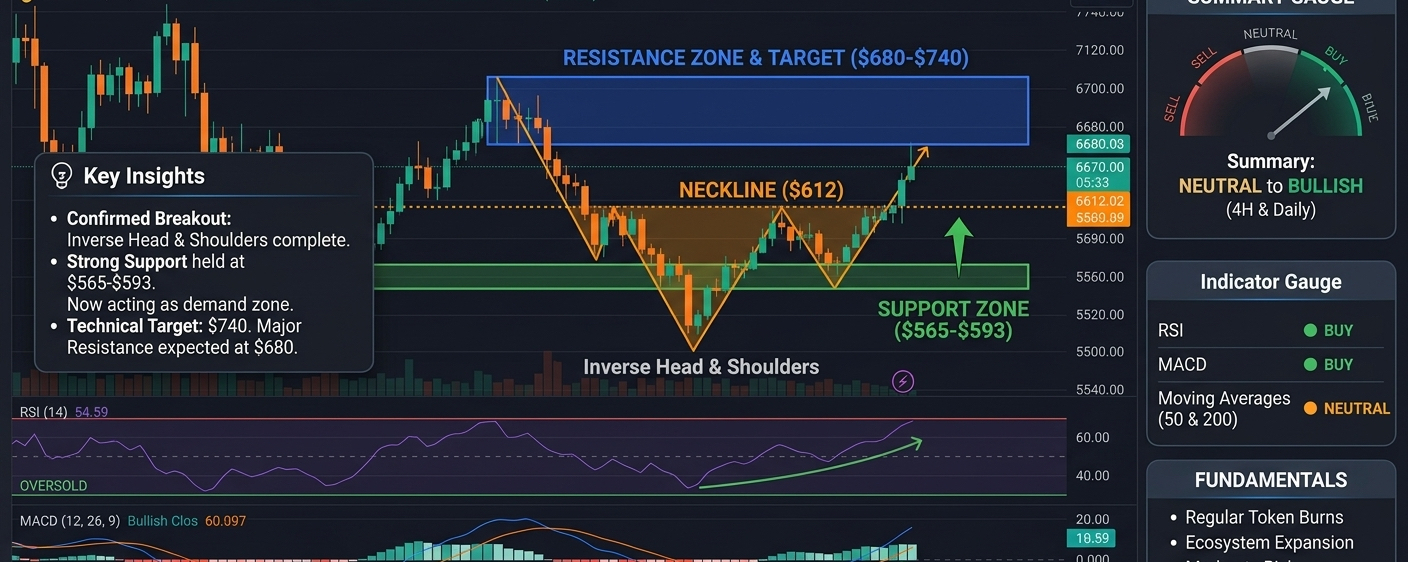
📊 Key Technical Highlights:
Pattern Breakout: The Inverse Head & Shoulders pattern has successfully broken above the crucial Neckline at $612.
Strong Support: The $565–$593 zone has acted as a solid demand area, preventing further downside. As long as BNB stays above this level, the bullish structure remains intact.
Indicators: Both RSI and MACD are flashing 'BUY' signals on the daily timeframe, showing growing upward momentum.
🎯 Targets & Resistance:
Immediate Resistance: Around $680.
Technical Target: If the momentum continues, the overall pattern target points towards $740.
What are your thoughts on BNB? Are we heading straight to $700+, or will we see a retest of the neckline first? Let me know in the comments! 👇
Disclaimer: This post is for educational and informational purposes only. Not financial advice. Always DYOR (Do Your Own Research) before trading! 🙏
#BNB #Binance #CryptoAnalysis #TechnicalAnalysis #cryptotrading
