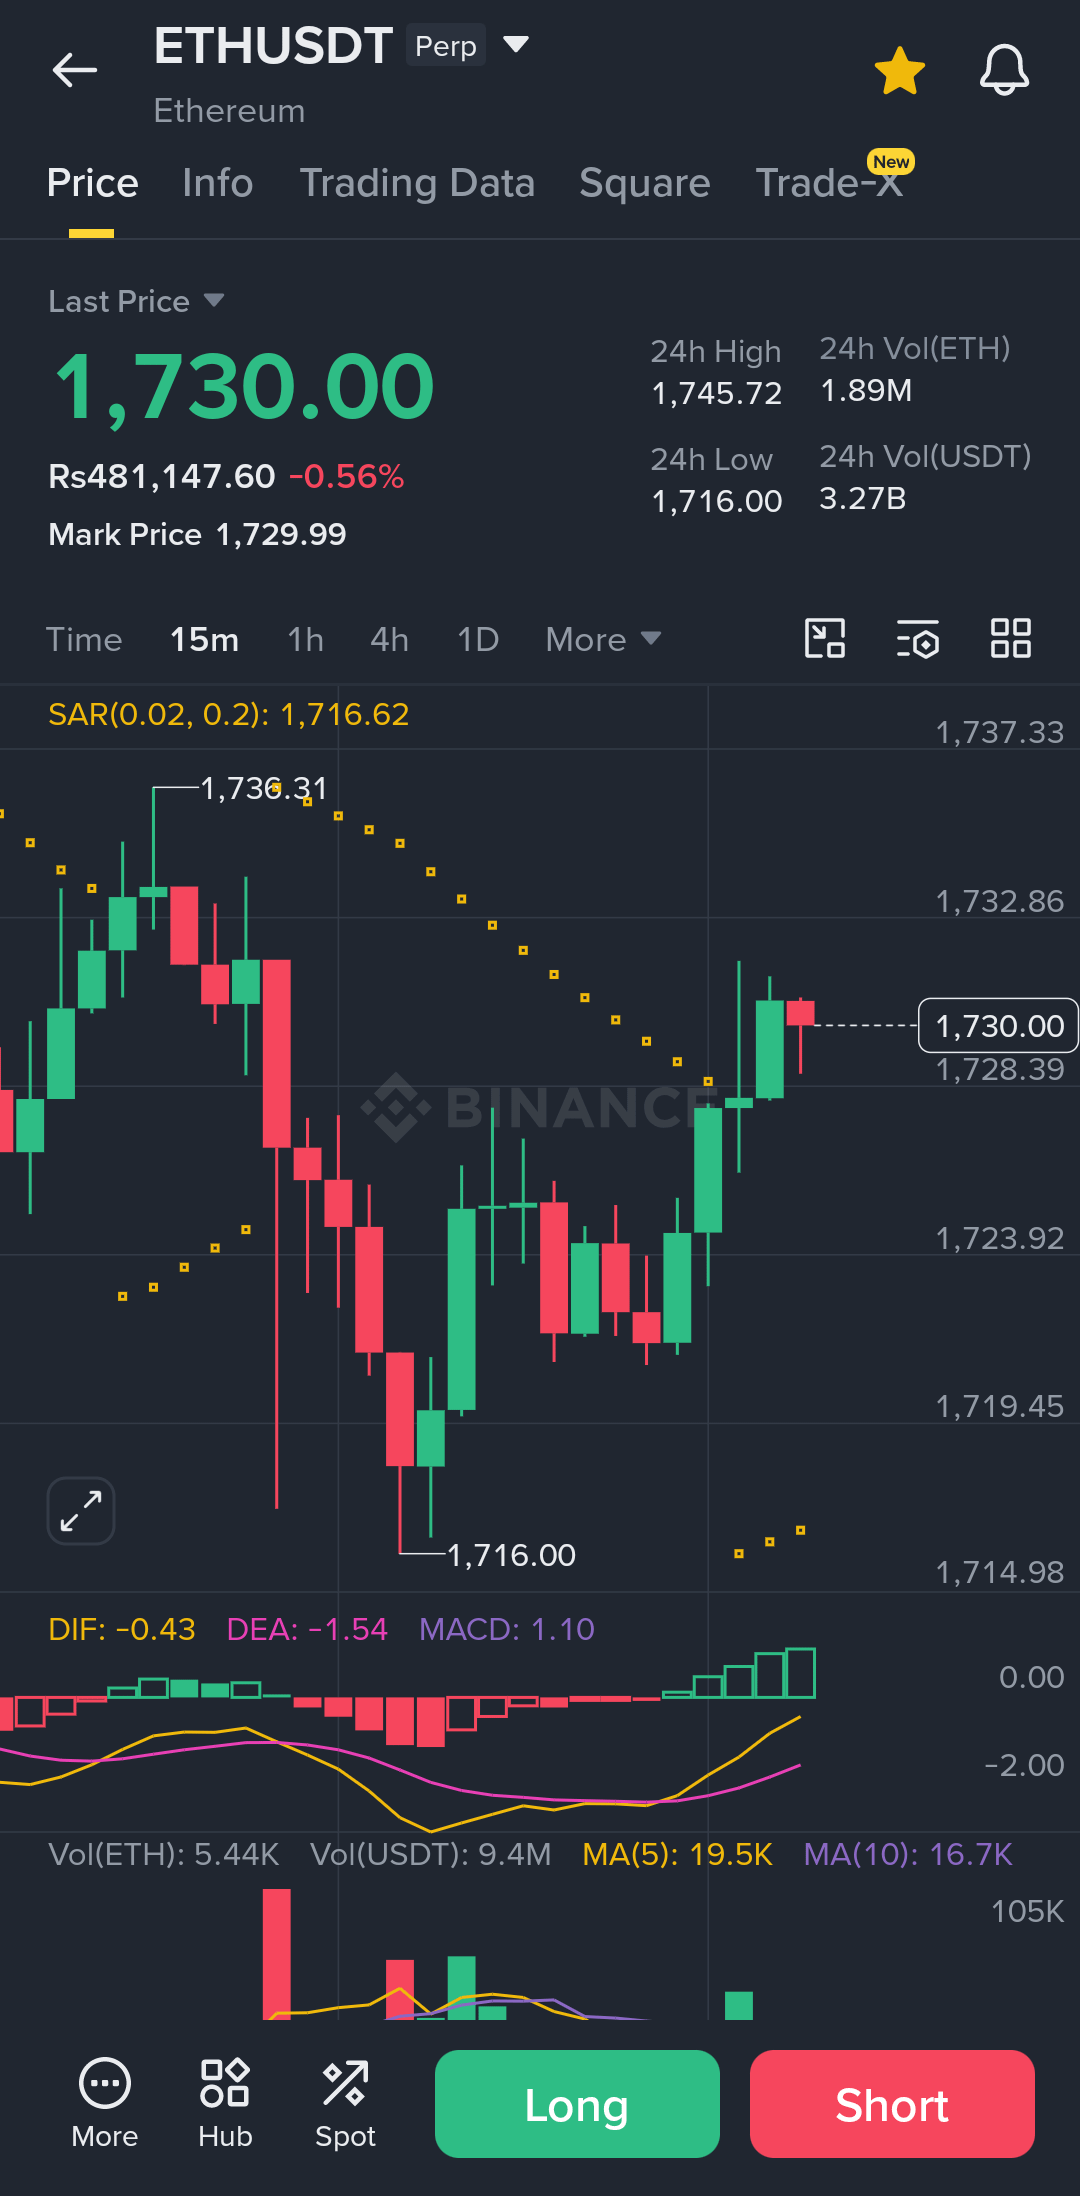
Ethereum's perpetual futures contract (ETHUSDT) on Binance is currently trading at $1,730.00, down 0.56% over the past 24 hours. The mark price sits marginally lower at $1,729.99, indicating the futures price is closely tracking the underlying index with minimal premium or discount.
24-Hour Range:
High: $1,745.72
Low: $1,716.00
Range spread: roughly $29.72, reflecting moderate intraday volatility
Trading Volume:
1.89M ETH
$3.27B USDT
This volume level suggests healthy liquidity, typical for a major perpetual contract, with no signs of unusually thin trading.
Price Action Review
Looking at the 15-minute candlestick chart, the session can be broken into three distinct phases:
1. Initial Rally and Rejection
Price pushed up to a local high near $1,730.31 before facing selling pressure. A sequence of green candles built momentum into this peak, but the move stalled and reversed.
2. Sharp Decline
Following the rejection, ETH entered a steep sell-off, marked by a long red candle with an extended lower wick reaching down to the session low of $1,716.00. This wick suggests aggressive intraday buying stepped in at that level, even though the close remained weak.
3. Recovery and Consolidation
After bottoming near $1,716, price staged a recovery, climbing back through the $1,720–$1,724 zone before breaking higher into the $1,728–$1,730 region, where it currently sits.
Indicator Analysis
Parabolic SAR (0.02, 0.2): The SAR dots were positioned above price during the decline, confirming the downtrend. As price recovered, the dots flipped below the candles, signaling a potential shift toward bullish momentum on this timeframe.
MACD (12, 26, 9):
DIF: -0.43
DEA: -1.54
MACD Histogram: 1.10
The histogram shows a clear transition from red (negative) bars during the decline to green (positive) bars during the recovery. The DIF line crossing above the DEA line, combined with the growing green histogram, points to strengthening short-term bullish momentum, though both lines remain in negative territory overall, meaning the broader 15-minute trend has not fully turned bullish yet.
Volume Profile:
MA(5): 19.5K
MA(10): 16.7K
A volume spike is visible during the sharp sell-off candle, consistent with panic selling or stop-loss triggering near the low. Volume on the recovery candles is comparatively lighter, which is worth watching — strong reversals are typically confirmed by rising volume on the way up.
Summary
ETHUSDT has carved out a V-shaped recovery on the 15-minute chart after testing the $1,716 level, with price reclaiming the $1,730 area. Momentum indicators (MACD, SAR) are leaning bullish in the short term, but the recovery volume is relatively modest compared to the volume seen during the decline. This divergence suggests the bounce, while real, may need stronger buying participation to confirm a sustained reversal rather than a temporary relief rally within a larger range.$ETH


#MorganStanleyETHSOLETFFilings0.14%Fee #IranWontBlockHormuzFor60Days #MSCIGivesSpaceXLowestESGRatingCCC