$BTC #SouthKoreaCryptoTaxPetitionReachesParliament #Iran$6BFrozenFundsToBeReturned 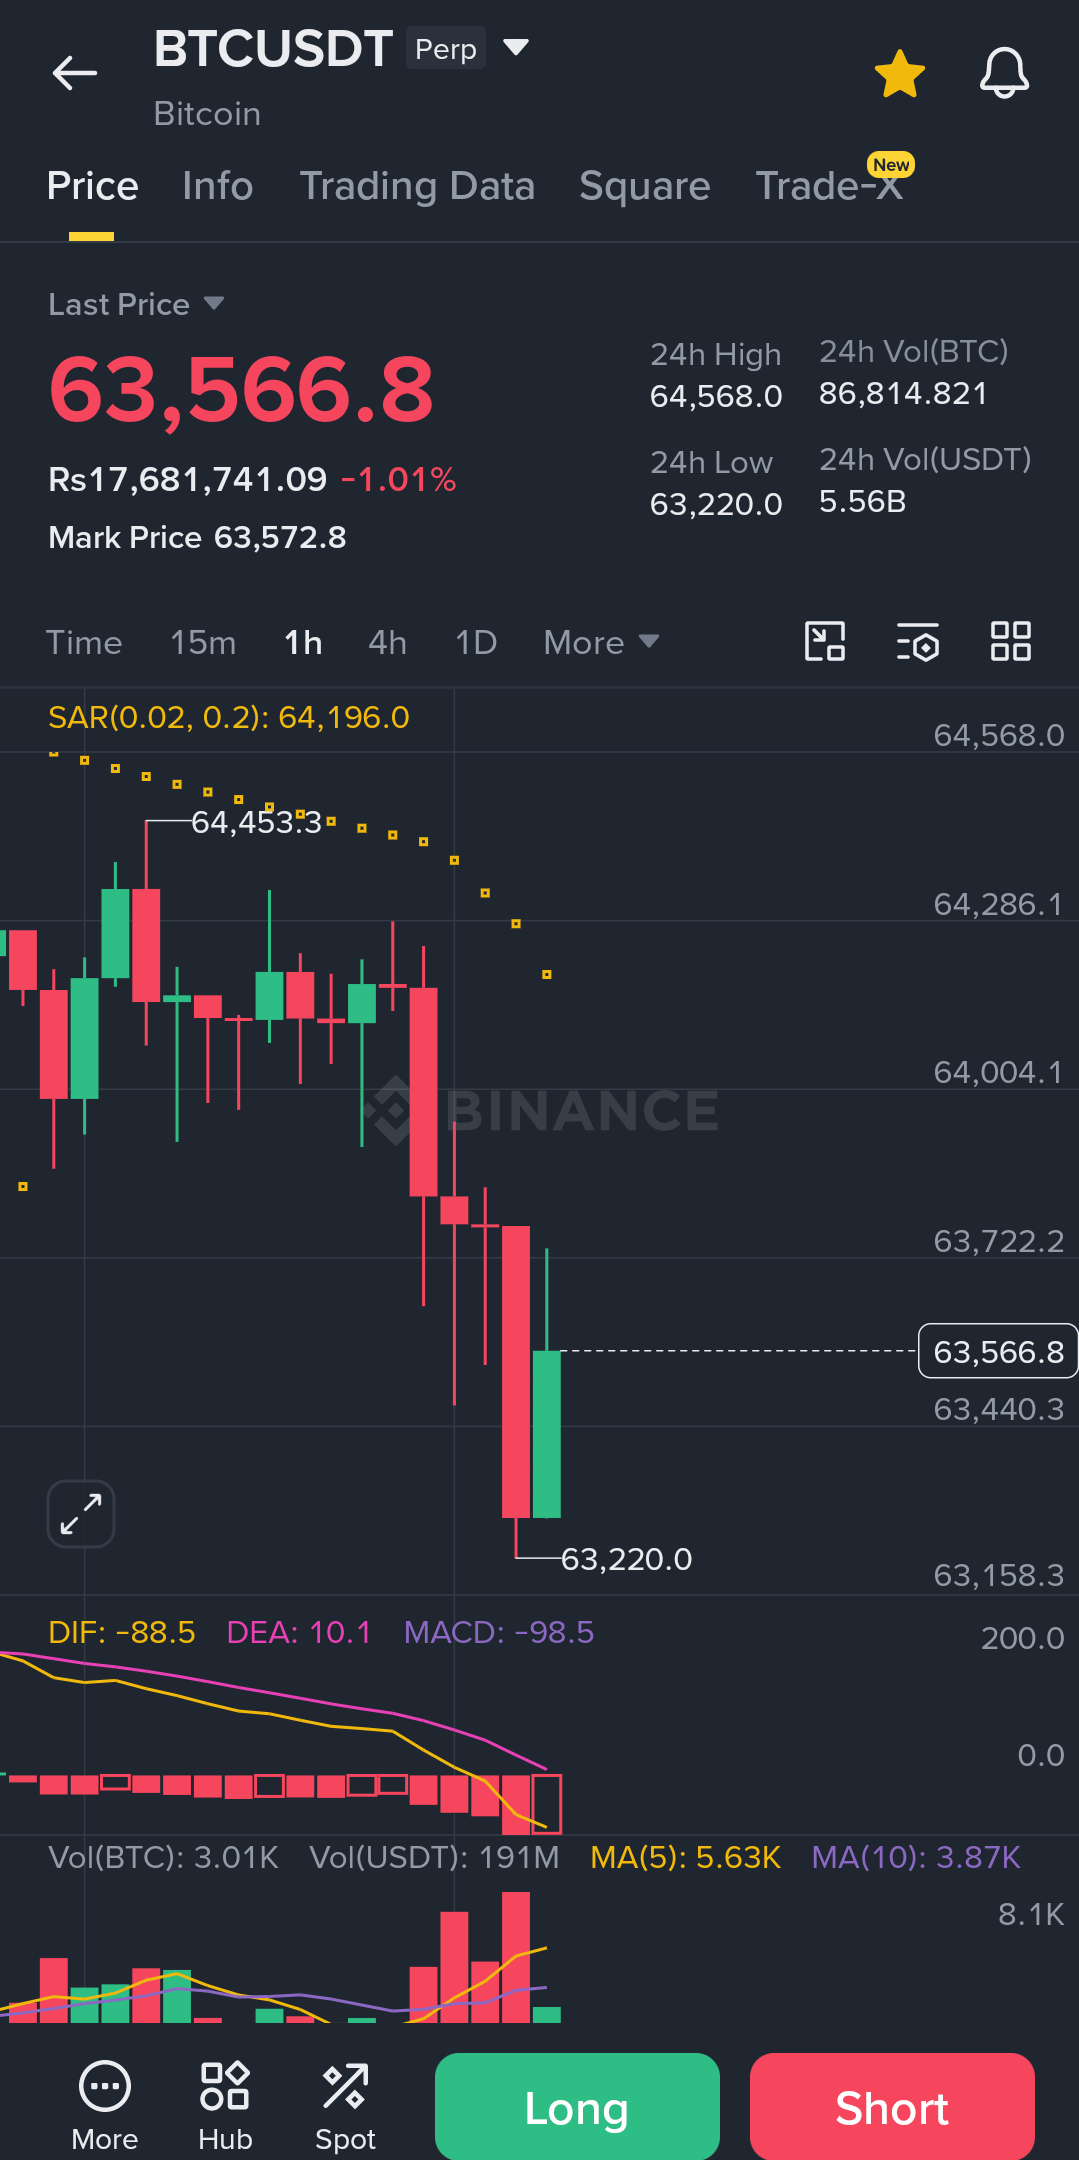
Current Price: $63,566.8 (-1.01% in 24h) | Mark Price: $63,572.8
24h Range: $63,220.0 – $64,568.0 | Volume: 86,814 BTC ($5.56B)
Price Action
Bitcoin has pulled back sharply on the 1-hour chart after topping out near $64,453. A series of red candles dragged price down to a low of $63,220 before a small green candle formed, suggesting a minor bounce attempt. The overall structure is a clear downtrend within the session.
Key Indicators
Parabolic SAR (0.02, 0.2): Dots sit above price at 64,196, confirming a bearish/downtrend signal — sellers remain in control for now.
MACD: DIF (-88.5) is below DEA (10.1), with the MACD histogram at -98.5 and expanding red bars — momentum is firmly negative.
Volume: A volume spike accompanied the drop to $63,220, indicating strong selling pressure rather than a low-conviction move.
Moving Averages (Volume): MA(5) at 5.63K is well above MA(10) at 3.87K, reflecting the recent surge in selling activity.
Support & Resistance
Immediate resistance: $63,722 → $64,004 → $64,286
Immediate support: $63,220 (24h low); a break below could open the door toward $63,158 or lower
Summary
The short-term trend is bearish — price, SAR, and MACD are all aligned to the downside, with volume confirming the move. The small green candle near the low could be an early sign of consolidation, but it hasn't yet flipped the trend. Confirmation of any reversal would likely need a close back above $63,722–64,004