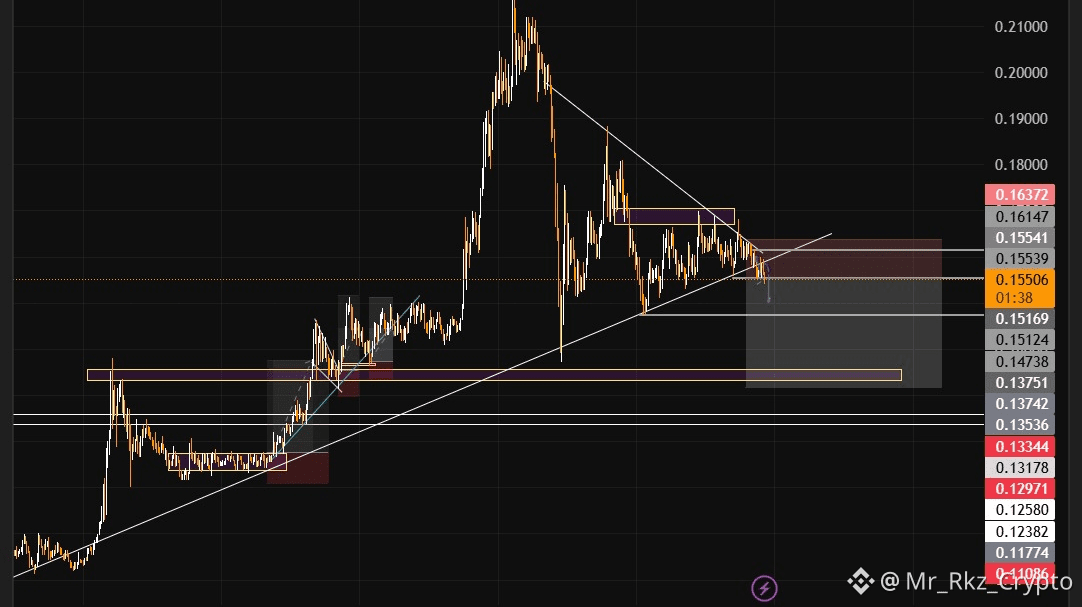
Der kurzfristige Trend für H/USDT ist derzeit bärisch. Nach einem signifikanten Aufwärtstrend bildete der Preis ein Konsolidierungsmuster (scheint ein symmetrisches Dreieck oder absteigendes Fähnchen zu sein) und hat kürzlich unter seine untere aufsteigende Unterstützungstrendlinie gebrochen. Dies deutet auf einen Verlust des bullischen Momentums und eine potenzielle Fortsetzung des Abwärtstrends vom jüngsten Höchststand hin.
$H

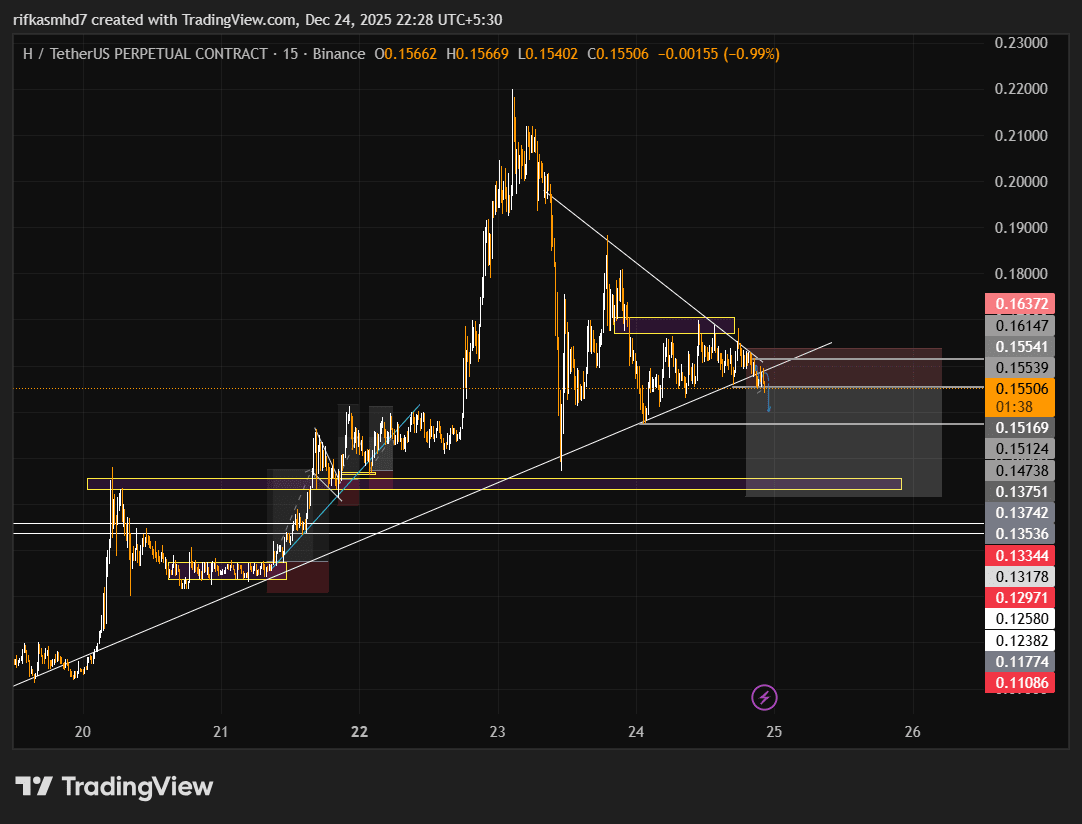
Angesichts des Durchbruchs aus dem Konsolidierungsmuster und des Handels unter den wichtigen kurzfristigen Unterstützungsniveaus ist die wahrscheinlichste sofortige Vorhersage weitere Abwärtsfortsetzung.
Wir erwarten, dass der Preis den 0.1510 - 0.1520 Unterstützungsniveau testen wird.
Wenn dieses Niveau nicht gehalten werden kann, wäre das nächste Ziel für Verkäufer die stärkere Unterstützungszone um 0.1370 - 0.1390.
Eine Rückkehr über den 0.1600 Widerstand wäre notwendig, um diese bearish Sichtweise kurzfristig zu widerlegen.