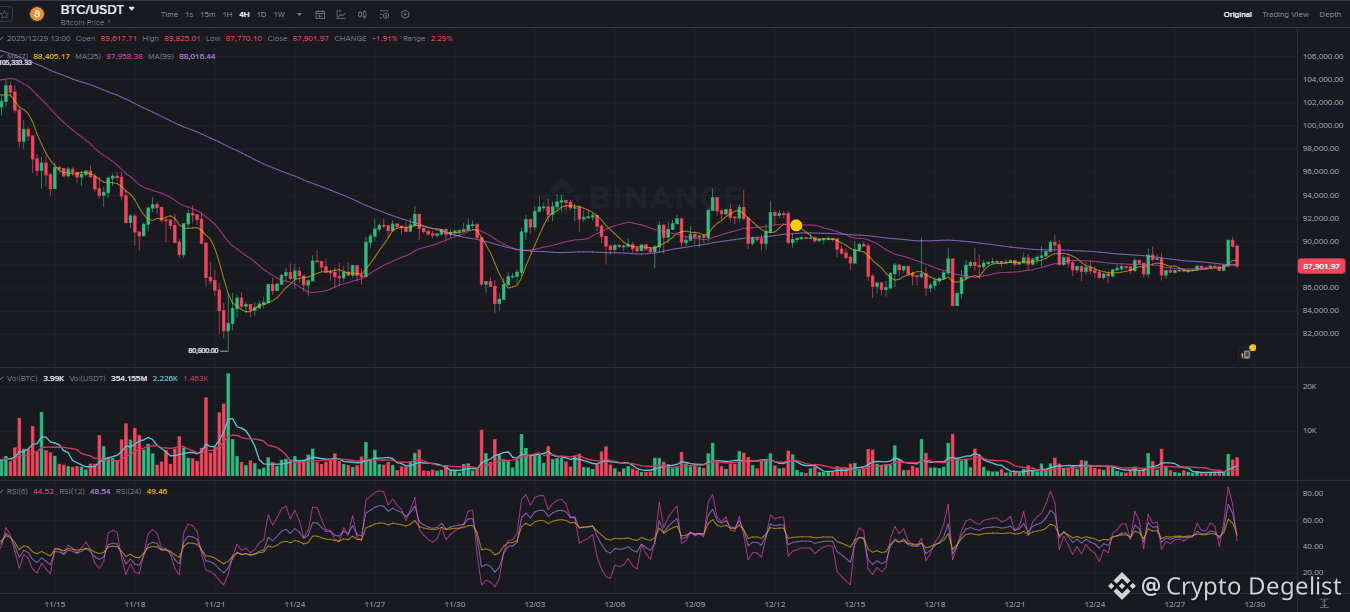
The weekend lull continues, but that's where precise technical setups are found. $BTC is still consolidating within the $86,000 - $90,000 range we identified this morning. Let's zoom into the 4-hour chart on Binance for a clearer tactical view.
📊 The Current Setup (BTC/USDT 4H):

Price Action: Trading around $88,190, caught between the 20 and 50 EMA on the 4H chart. This confirms the neutral, range-bound structure.
Key Levels to Watch:
Immediate Resistance: $88,800 (aligned with the 20 EMA and previous minor highs).
Upper Range Boundary: $90,000 (the ceiling for a breakout).
Immediate Support: $87,000 (recent swing low).
Lower Range Boundary: $86,000 (must hold for bullish structure).
🔍 The Triple RSI Tells the Story:
Using Binance's built-in indicator, we get a nuanced momentum read:
RSI (24) - The Trend: Hovering just below 50, confirming the short-term bearish bias and lack of strong underlying bullish momentum.
RSI (12) - The Momentum: Sitting near 45, in neutral territory but leaning weak. It needs to climb above 50 to signal a shift in momentum for a push toward $90K.
RSI (6) - The Trigger: Currently at 42. Watch this closely for a sharp hook above 50 as the first sign of short-term buying pressure returning.
🎯 Trading Perspective:
This is a classic range play. The strategy is to wait for a confirmed bounce off a boundary with RSI alignment.
Bullish Scenario: A hold above $87,000 with RSI (6) crossing above 50 could signal a bounce toward $88,800. A break and close above that opens the path to $90,000.
Bearish Scenario: A breakdown below $87,000 with rising volume would target a test of the crucial $86,000 support. A break below invalidates the range.
🤔 Your Move:
Given this setup, are you:
Waiting for the $90K breakout before entering?
Looking to buy a dip near $86K support?
Staying flat, expecting more chop?
Drop your number below! Follow for clear, chart-driven insights.
#Bitcoin #BTC #TechnicalAnalysis #TradingSetups #cryptooinsigts