$1INCH is currently trading around $0.1413, down -1.46% on the day. The chart shows a consistent downward structure with lower highs & lower lows, indicating bears still in control.
🔍 Market Snapshot
📌 Price: $0.1413
📌 24H High: $0.1449
📌 24H Low: $0.1400
📌 7D Performance: -5.67%
📌 30D Performance: -26.02%
📌 90D Performance: -45.49%
Technical Breakdown 🧠
Price trading below MA(7), MA(25), MA(99) → bearish trend
Volume decreasing → low momentum phase
Major support visible near $0.1036 – $0.1400 zone
Breakout resistance lies around $0.158 – $0.17 range
Short-Term View
🔴 Trend remains bearish unless price reclaims $0.158+
🟡 Possible accumulation if price enters strong support zone
🟢 A reversal confirmation requires volume + MA breakout
Trading Thoughts (Not Financial Advice)
✔️ Good for watchlist — potential swing if support holds
✖️ Avoid catching falling knife without reversal signal
📊 Best approach: wait for structure change / retest breakout zones
💬 Do you think 1INCH will bounce from this support or continue lower?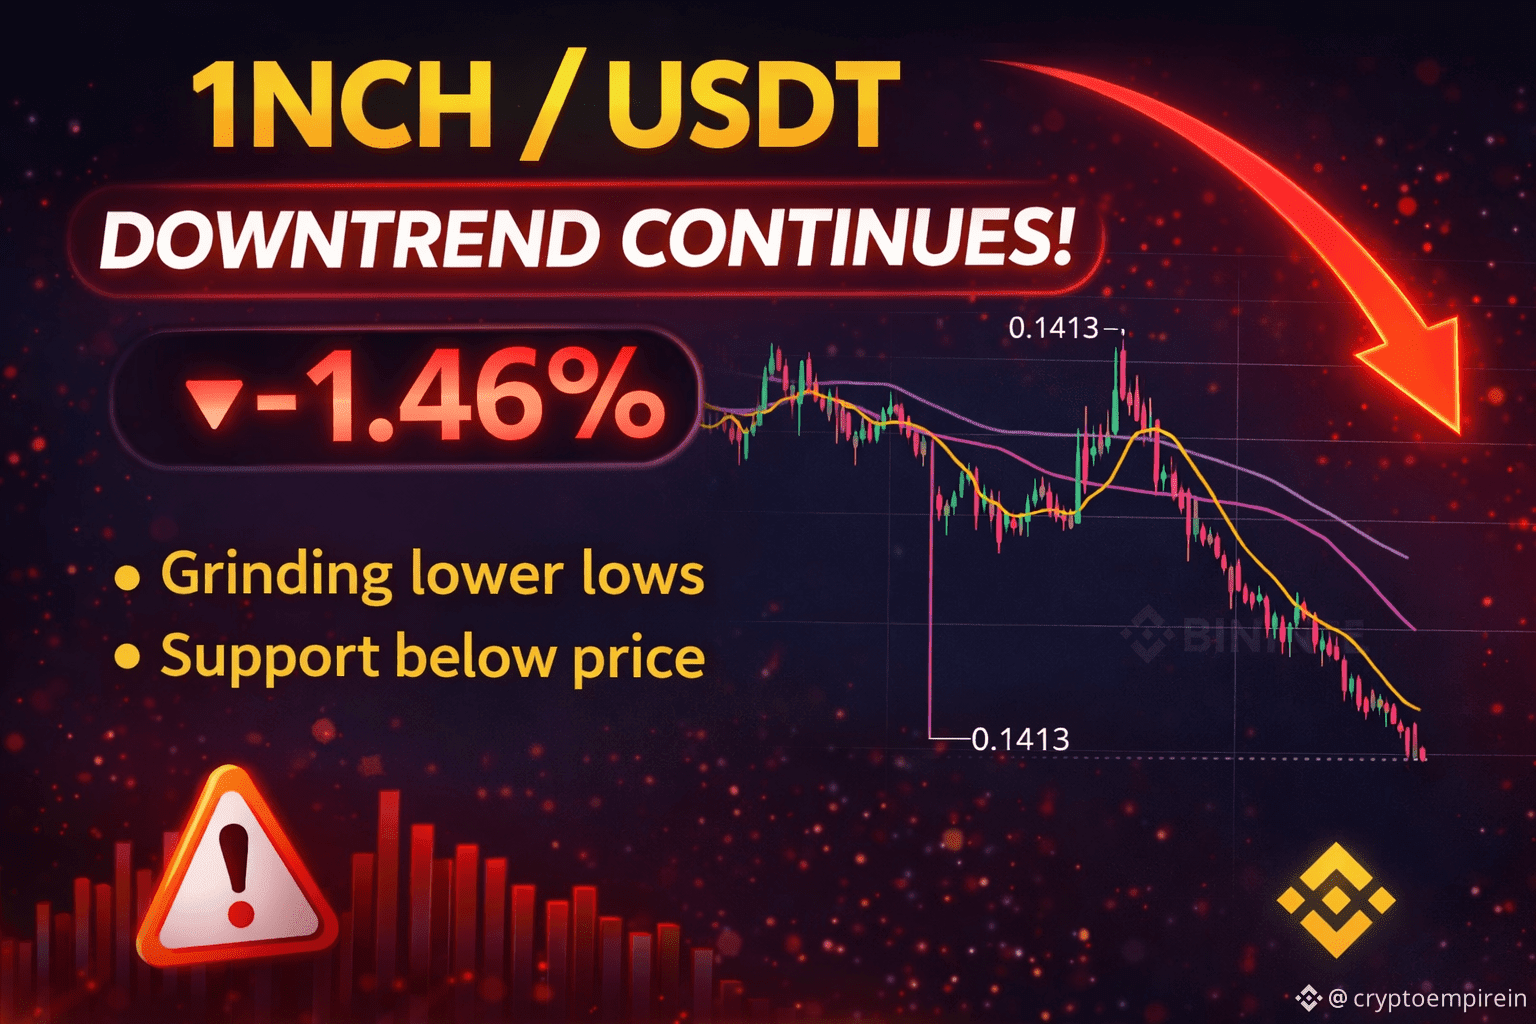
Comment your view 👇