Basierend auf dem Chart, den Sie für $TLM im 5-Minuten-Zeitrahmen geteilt haben, zeigt der Preis derzeit Anzeichen einer kurzfristigen Erholung nach einer Phase des Verkaufsdrucks.
Hier ist eine Übersicht darüber, was die technischen Indikatoren signalisieren:
1. Gleitender Durchschnitt Konvergenz
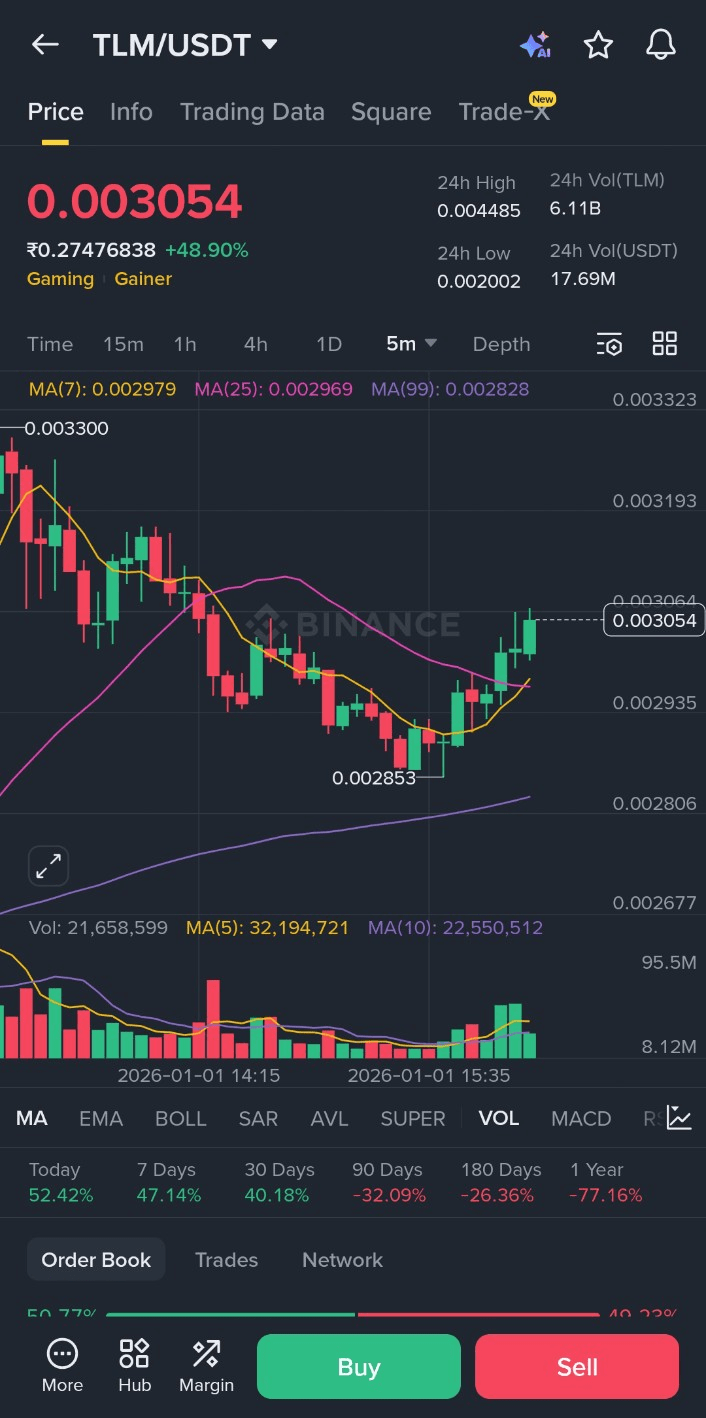
In der Mitte des Charts überschreitet die gelbe Linie (MA7) die lila Linie (MA25). Dies wird oft als "Bullish Cross" auf einem kurzen Zeitraum bezeichnet. Es deutet darauf hin, dass sich der unmittelbare Momentum von Verkauf zu Kauf verschoben hat.
2. Unterstützung und Widerstand
Unterstützung: Der Preis fand eine klare Unterseite bei 0,002853. Solange der Preis über diesem Niveau bleibt, bleibt der kurzfristige Aufwärtstrend intakt.
Widerstand: Der Preis steht derzeit einem Widerstand nahe der 0,003100-Grenze gegenüber. Er erreichte zuvor ein Maximum nahe 0,003300, was die nächste bedeutende Hürde darstellen würde, falls dieser Aufwärtstrend weitergeht.
3. Volumentrends
Die Volumenbalken am unteren Rand zeigen eine leichte Zunahme des grünen (Kauf-) Volumens, während der Preis steigt. Das Volumen ist jedoch noch nicht "explosiv". Für einen anhaltenden Durchbruch müssten die grünen Balken erheblich höher werden als die vorherigen roten.
Zusammenfassungstabelle
Indikatorstatus-Interpretation
Aktueller Preis 0,003054 Erholung von den jüngsten Tiefpunkten.
Trend (5m) Bullish Der Preis liegt über den kurzfristigen gleitenden Durchschnitten.
24h-Änderung +48,90 % Hochvolatil; deutet auf einen "Gewinner"-Tag hin.
Langfristig bärisch Der 1-Jahres-Rückgang beträgt -77,16 %, was auf einen langfristigen Abwärtstrend hindeutet.
