Basierend auf dem Diagramm, das Sie für $ZEN/USDT geteilt haben, hier eine Aufschlüsselung dessen, was die aktuellen technischen Indikatoren vorschlagen.
1. Aktuelle Preisbewegung
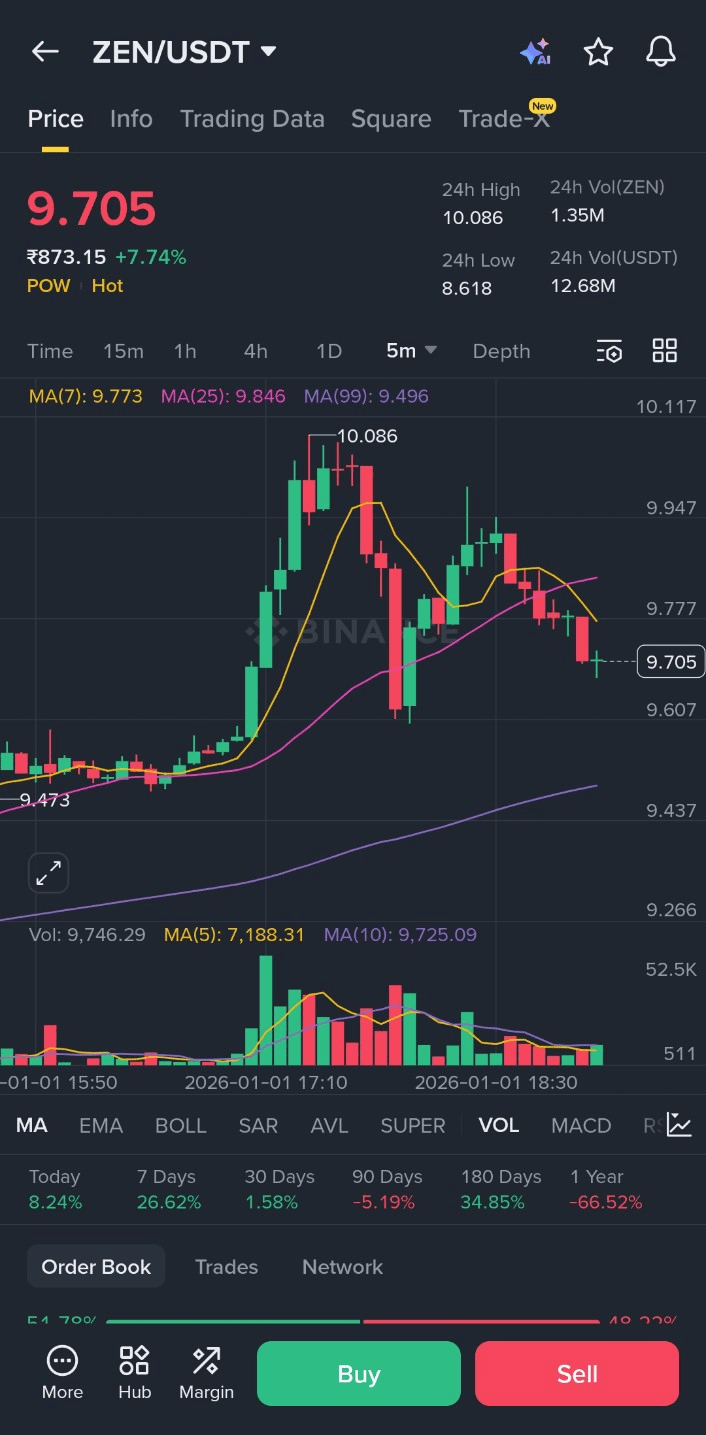
Das Diagramm zeigt einen signifikanten "Pump", gefolgt von einer Phase hoher Volatilität. Nachdem ein Höchststand von 10,086 erreicht wurde, hat der Preis zurückgesetzt und kämpft derzeit darum, einen soliden Boden zu finden.
Aktueller Stand: Der Preis liegt bei 9,705, was unter den gleitenden Durchschnitten von 7 Perioden (Gelb) und 25 Perioden (Pink) liegt. Dies deutet normalerweise auf kurzfristigen Verkaufsdruck hin.
Trend: In der unmittelbaren 5-Minuten-Periode sehen wir niedrigere Hochs, was darauf hindeutet, dass die ursprüngliche Aufwärtsbewegung an Dynamik verliert.
2. Gleitende Durchschnitte (MA)
Mittelwerte helfen dabei, die Preisbewegung zu glätten, um die Trendrichtung zu identifizieren.
MA(7) & MA(25): Der Preis ist unter diese Linien abgesunken. Wenn der Preis unter der gelben Linie (MA 7) bleibt, deutet dies typischerweise auf einen kurzfristigen Abwärtstrend hin.
MA(99): Diese lila Linie ist derzeit bei etwa 9,496 nach unten gerichtet. Dies ist ein wichtiger Unterstützungslevel. Wenn der Preis weiter fällt, schauen Händler oft auf diese Linie, um zu sehen, ob Käufer wieder einsteigen.
3. Volumenanalyse
Die Volumenbalken am unteren Rand zeigen, dass das höchste Kaufvolumen während des Sprungs auf 10,0 aufgetreten ist. Seitdem ist das Volumen zurückgegangen.
Bedeutung: Rückläufiges Volumen während eines Preisanstiegs deutet oft darauf hin, dass der "Verkauf" nicht aggressiv ist, aber das Fehlen von "Kauf"-Volumen bedeutet, dass noch nicht genügend Kraft vorhanden ist, um den Preis wieder nach oben zu treiben.
Wichtige Levels zur Beobachtung
Level-Typ Bedeutung
10,08 Widerstand Der letzte Höchststand; der Preis muss diesen Wert durchbrechen, um den Aufwärtstrend fortzusetzen.
9.60 Unterstützungslevel Ein psychologisches Niveau, an dem der Preis vorher kurz反弹 (zurückprallte).
9,50 Starke Unterstützung Dort befindet sich der langfristige MA(99) derzeit.
Zusammenfassung
Das Diagramm sieht aus wie eine gesunde Korrektur nach einer großen Bewegung, aber es hat sich noch nicht stabilisiert. Wenn der Preis über 9,50 bleibt, könnte er sich konsolidieren, bevor eine weitere Aufwärtsbewegung erfolgt. Falls er jedoch unter diese lila Linie bricht, könnte der kurzfristige Aufwärtstrend beendet sein.
