Basierend auf dem Chart, den Sie für $F/USDT auf Binance geteilt haben, hier eine Aufschlüsselung dessen, was die aktuellen technischen Indikatoren vorschlagen.
Bitte beachten Sie, dass dies ein 5-Minuten-(kurzfristiger) Chart ist, was bedeutet, dass die Preisbewegung hochgradig volatil ist und sehr aktuelle Stimmungen widerspiegelt, anstatt langfristigen Wert.
1. Gleitende Durchschnitte (MA)
Der Preis wird derzeit genau um seine kurzfristigen Gleitenden Durchschnitte gehandelt.
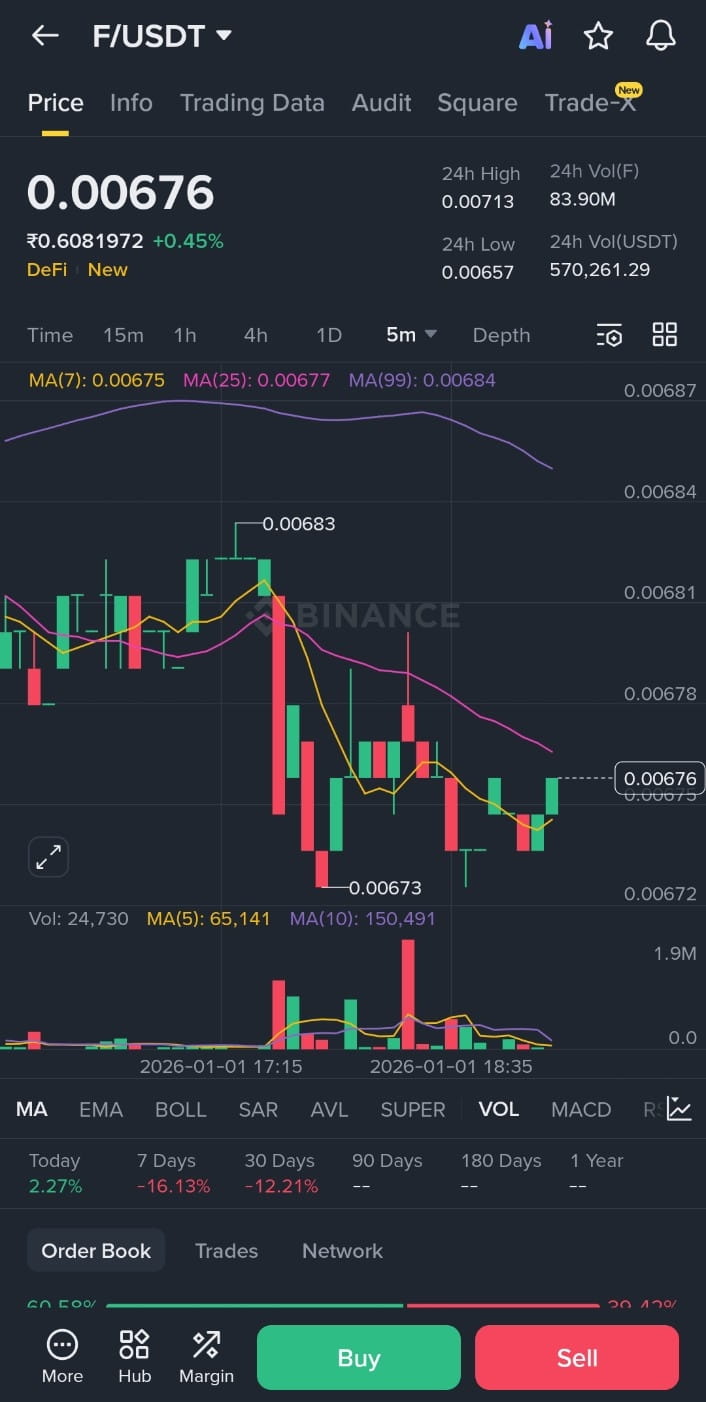
MA(7) (Gelb): 0.00675
MA(25) (Rosa): 0.00677
MA(99) (Lila): 0.00684
Der Preis liegt derzeit unter dem langfristigen MA(99), was im Allgemeinen einen kurzfristigen bärischen Trend anzeigt. Allerdings zeigen die letzten Kerzen eine leichte Erholung, da der Preis versucht, wieder über den MA(7) zu steigen.
2. Kerzenmuster & Preisbewegung
Aktueller Preis: 0,00676
Support & Widerstand: Sie können eine klare "Bodenzone" (Support) bei 0,00673 erkennen, wo der Preis kürzlich abprallte. Unmittelbarer Widerstand liegt bei 0,00683, wo der Preis vor dem starken Rückgang seinen Höhepunkt erreichte.
Volatilität: Die großen roten Kerzen, gefolgt von kleinen, unruhigen grünen und roten Kerzen, deuten darauf hin, dass der Markt nach einem starken Verkaufsvorgang derzeit in einer "Konsolidierungsphase" ist – Käufer und Verkäufer kämpfen um die Kontrolle.
3. Volumentrends
Betrachtet man den unteren Teil Ihres Charts, gab es während des Rückgangs einen signifikanten Anstieg des roten Volumens. Dies deutet auf starke Verkaufsdruck hin. Das Volumen bei der Erholung (grüne Balken) ist derzeit viel geringer, was bedeutet, dass der "Rückprall" nach oben noch nicht viel Überzeugung oder Stärke hinter sich hat.
Wichtige Zusammenfassung
Trend: Kurzfristig bärisch/neutral.
Der "Bullen"-Fall: Wenn der Preis über 0,00677 (die rosa Linie) bricht und dort bleibt, könnte er das Niveau von 0,00683 erneut testen.
Der "Bären"-Fall: Wenn er 0,00675 nicht halten kann und unter 0,00673 fällt, könnte er weiter abwärts in Richtung neuer Tiefpunkte laufen.