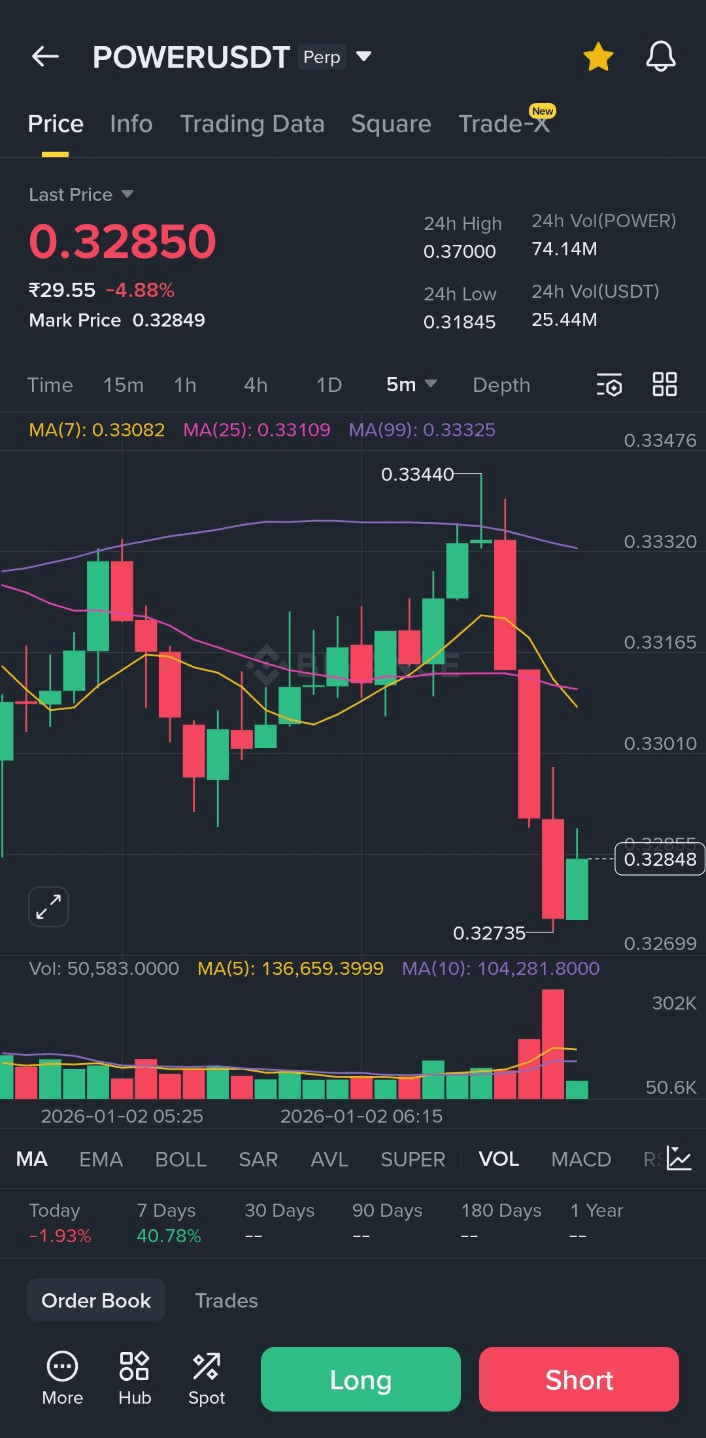
Basierend auf dem Diagramm, das Sie für $POWERUSDT (Perpetual) geteilt haben, hat der Markt gerade einen plötzlichen kurzfristigen bärischen Rückgang erlebt.
Hier ist eine Übersicht darüber, was die technischen Indikatoren anzeigen:
1. Preisaktion & Kerzenständer
Das auffälligste Merkmal ist die große rote "Marubozu-Stil"-Kerze, gefolgt von einem weiteren signifikanten Rückgang. Dies deutet auf einen plötzlichen Anstieg des Verkaufsdrucks hin, der leicht durch frühere kleinere Unterstützungsniveaus gebrochen ist. Der aktuelle Preis liegt bei 0.32850 und erholt sich leicht von einem kürzlichen Tief von 0.32735.
2. Gleitende Durchschnitte (MA)
MA(7) - Gelb: Aktuell bei 0,33082. Der Kurs handelt deutlich unter diesem kurzfristigen Durchschnitt, was gewöhnlich ein Zeichen für sofortiges bärisches Momentum ist.
MA(25) - Rosa: Bei 0,33109. Der Kurs ist unter diese Linie gefallen, was oft auf eine Verschiebung von einem neutralen/bullischen Trend zu einem bärischen Trend hindeutet.
Todesskreuz-Potential: Die MA(7) krümmt sich scharf nach unten in Richtung der MA(25) und MA(99). Wenn sie diese unterschreitet, bestätigt dies einen stärkeren Abwärtstrend.
3. Volumen
Es gab einen massiven Volumensprung (durch den hohen roten Balken unten angezeigt) während des Kursrückgangs. Dies deutet darauf hin, dass die Bewegung durch erhebliche Handelsaktivität unterstützt wurde – dies ist kein bloßes "Rauschen"; es ist eine entscheidende Bewegung des Marktes.
Zusammenfassung der Stimmung
Kurzfristig: Bärisch. Die Momentum ist derzeit auf Seiten der Verkäufer.
Unterstützung: Das unmittelbare Niveau, auf das zu achten ist, liegt bei 0,32735. Wenn es diesen Wert unterschreitet, könnte der nächste Abwärtstrend erheblich sein.
Widerstand: Das Gebiet bei 0,33100 (wo die MAs gruppiert sind) wird nun wahrscheinlich als "Decke" oder Widerstand wirken, falls der Kurs versucht, zurückzukehren.
