Es sieht so aus, als würdest du das Bitcoin ($BTC BTC/USDT) 5-Minuten-Diagramm genau im Auge behalten. Basierend auf dem Screenshot vom 2. Januar 2026 zeigt der Markt eine signifikante kurzfristige Volatilität.
Hier ist eine Aufschlüsselung dessen, was das Diagramm uns gerade sagt:
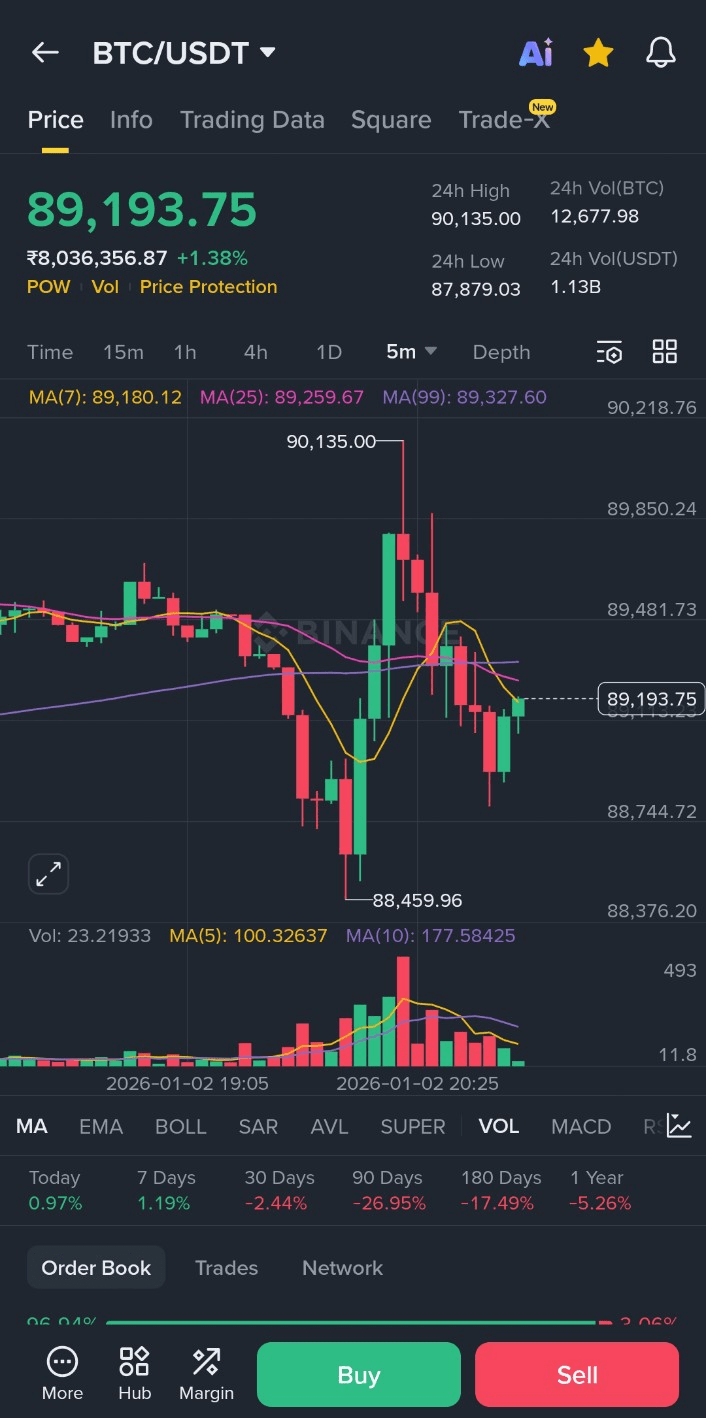
Aktuelle Preisaktion
Preis: $89,193.75 (ungefähr 1,38% am Tag gestiegen).
Kürzlicher Hoch/Tief: Der Preis ist kürzlich auf $90,135.00 gestiegen, bevor er auf eine starke Ablehnung stieß und auf ein Unterstützungsniveau von etwa $88,459.96 fiel.
Trend: Die Kerzen befinden sich derzeit unter den wichtigen gleitenden Durchschnitten (MA7, MA25 und MA99), was oft auf eine kurzfristige bärische oder "Abkühlungsphase" hindeutet, nachdem der gescheiterte Versuch, $90k zu halten.
Wichtige technische Indikatoren
Gleitende Durchschnitte (MA): Der MA(7) (gelbe Linie) ist unter den MA(25) (rosa Linie) und den MA(99) (lila Linie) gefallen. Dieser "Todessignal" auf einem kleineren Zeitrahmen deutet typischerweise auf abwärts gerichtete Dynamik in der unmittelbaren Zukunft hin.
Volumen: Es gab einen deutlichen Anstieg der roten Volumenbalken während des Rückgangs von 90.000 USD, was darauf hindeutet, dass Verkäufer zu diesem Zeitpunkt sehr aggressiv waren.
Unterstützung/Widerstand: * Widerstand: Der Bereich von 90.100 bis 90.200 USD wirkt offensichtlich wie eine starke "Decke."
Unterstützung: Käufer scheinen sich um die Marke von 88.400 USD einzuschalten.
Auf was zu achten ist
Wenn Sie nach einer potenziellen Einstiegs- oder Ausstiegsgelegenheit suchen, achten Sie auf diese beiden Szenarien:
Bullischer Rückschlag: Wenn BTC wieder steigen und einige 5-Minuten-Kerzen über der lila Linie (MA99) bei 89.327 USD schließen kann, könnte ein erneuter Anlauf auf das Niveau von 90.000 USD unternommen werden.
Bärenhafter Fortsetzung: Wenn es nicht gelingt, 89.300 USD zu durchbrechen und stattdessen zurück zum jüngsten Tief von 88.459 USD fällt, könnte eine tiefere Korrektur bis zum Niveau von 87.800 USD (24-Stunden-Tief) erfolgen.
