Bitcoin's price action remains a focal point for traders navigating the volatile cryptocurrency landscape, where recent consolidation hints at potential mean reversion plays amid thinning liquidity pockets. With no fresh news catalysts disrupting the market, the spotlight turns squarely to technical structure, where observable patterns on the 4-hour BTCUSDT chart suggest a delicate balance between buyers and sellers, potentially setting up for volatility expansion if key levels are tested decisively.
Market Snapshot:
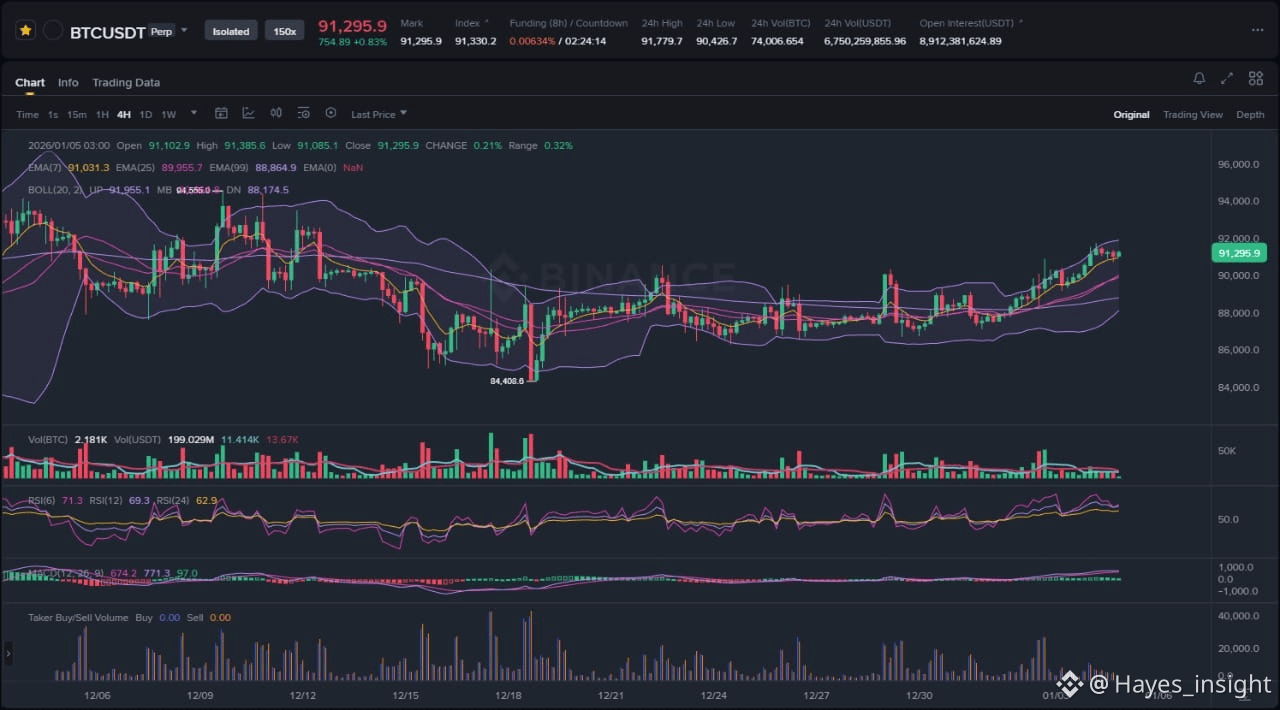
The BTCUSDT pair is currently trading within a defined range following a multi-week correction from the recent local swing high around 73,000. Volume profiles indicate contracting participation, with the lower volume node aligning near the range midpoint, suggesting limited conviction in either direction. The chart displays a classic range-bound structure, characterized by repeated rejections at the upper boundary near 72,000 and defensive buying at the lower boundary around 62,000. Oscillators like RSI (14) hover in neutral territory around 50, while the MACD histogram shows flattening momentum, reinforcing the absence of impulsive moves. This setup reflects a distribution phase cooldown after the prior rally, with liquidity building at both range extremes for potential sweeps.
Chart Read:
Delving deeper into price action, the structure is unambiguously range-bound, with no confirmed breakout attempt materializing despite brief probes above the range top. Key observable elements include a double-top rejection at the upper range boundary, marked by a bearish engulfing candle cluster accompanied by elevated wick formation, signaling seller dominance at that liquidity pocket. Lower timeframe consolidation forms a symmetrical triangle pattern compressing toward the range midpoint, hinting at impending volatility expansion. Local swing lows near 62,000 have held with bullish hammer formations and volume spikes, indicating buyer interest in dip-buying opportunities. The main bias here is neutral, driven by the lack of trend resumption signals—neither bulls nor bears have claimed control, as evidenced by the balanced Bollinger Bands squeeze and failure to breach the 200-period EMA. This neutral stance persists until a clear displacement occurs, avoiding premature directional bets in a low-conviction environment.
News Drivers:
In the absence of recent news items, the BTC market operates in a vacuum of fundamental drivers, allowing pure technicals to dominate. This lack of catalysts translates to a neutral sentiment overlay—no bullish themes like institutional adoption surges or regulatory tailwinds, nor bearish pressures from macroeconomic shocks or exchange disruptions. Historically, such quiet periods precede mean reversion toward the range mean or liquidity grabs at extremes, but without conflicting narratives, there's no divergence to highlight between news and price. The void amplifies chart-driven moves, where traders eye order flow imbalances rather than headline risks. Broader macro themes linger in the background, such as potential Federal Reserve rate cut speculations supporting risk assets, but these remain stale without fresh updates, keeping the net impact mixed-to-neutral for BTC.
Technical Scenarios:
For bullish continuation, price must first achieve a clean breakout above the range top near recent highs, accompanied by expanding volume and a momentum thrust on RSI above 60. This would invalidate the range structure, targeting liquidity pockets above prior swing highs, potentially filling upper volume gaps in a measured move extension. Sustained closes above the upper Bollinger Band with bullish MACD crossover would confirm buyer control, aligning with mean reversion from oversold conditions observed in the lower range.
Conversely, bearish invalidation looms if sellers defend the range top once more, leading to a breakdown below the range bottom near local swing lows. A liquidity sweep below 62,000—fakeout probe followed by rejection—could accelerate toward the prior impulse low, especially if volume surges on the downside. Failure to hold the 200 EMA as dynamic support would signal distribution resumption, with the symmetrical triangle resolving lower in a high-probability fakeout scenario.
In a neutral prolongation case, price may oscillate within the range, grinding toward the midpoint via choppy consolidation. This fakeout-prone environment suits range traders targeting liquidity at both ends, but risks escalation if external volume ignites a trend shift.
What to Watch Next:
Monitor volume behavior at range boundaries—surges above average on upside breaks signal genuine bullish intent, while fading volume on rallies warns of traps. Track price reaction at key areas like the upper rejection zone or lower support, where wick length and candle closes reveal order flow strength. Momentum divergence on RSI or MACD could precede reversals, particularly if histogram bars expand amid contracting price ranges. Liquidity sweeps—quick probes beyond extremes followed by snapbacks—often precede true directional moves, offering high-probability entries for aligned traders.
Risk Note:
While the range-bound setup offers defined risk parameters, sudden news events could trigger volatility spikes, invalidating technical biases rapidly. Position sizing remains crucial in this low-liquidity phase, where stop hunts target clustered orders at swing levels.
BTC's fate hinges on whether range breakers materialize with conviction or conviction.
#BTC #CryptoAnalysis #BTCUSDTAnalysis