Ethereum's ETH/USD pair continues to navigate a precarious balance between lingering bullish momentum from recent cycles and mounting resistance pressures, as evidenced by the latest chart snapshot revealing tight consolidation patterns that could prelude either mean reversion or a decisive breakout. In an environment devoid of fresh headlines, the market's internal dynamics take center stage, forcing traders to scrutinize pure price action for clues on liquidity distribution and potential volatility expansion. This analysis dissects the current structure, evaluates the vacuum of news influence, and outlines probabilistic scenarios to guide informed observation.
Market Snapshot:
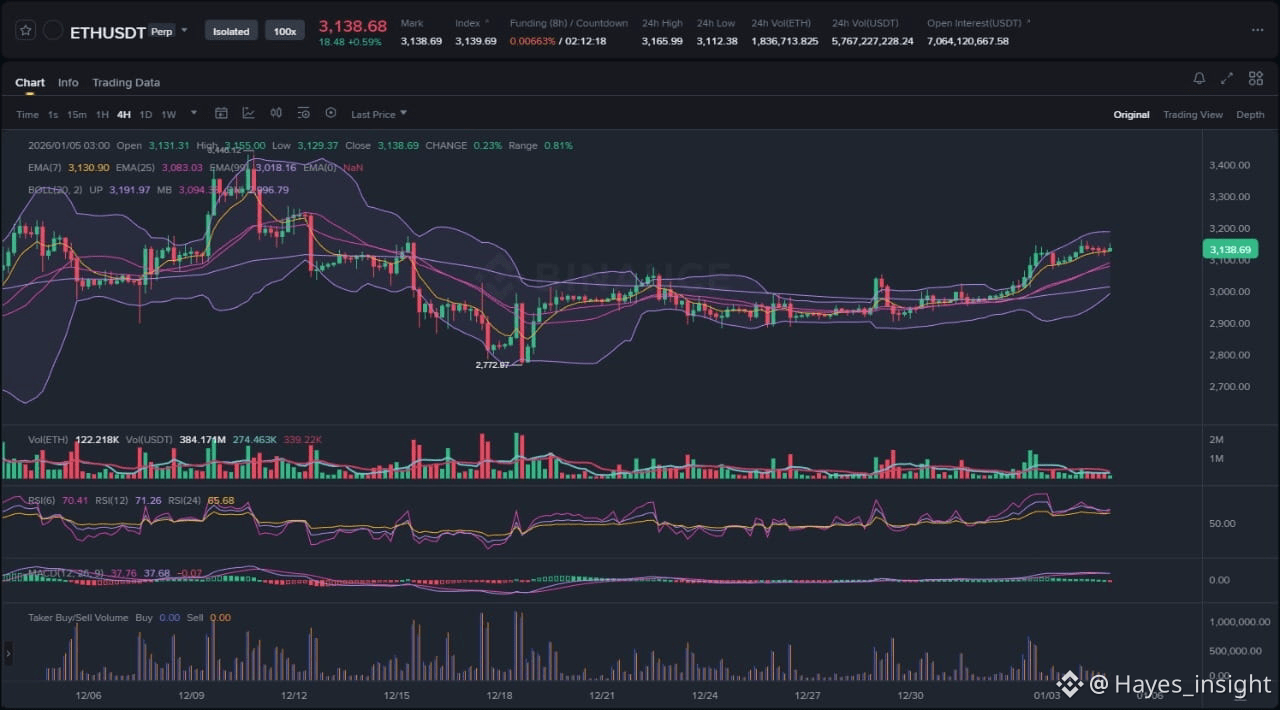
The ETH chart on a 4-hour timeframe displays a clear range-bound structure, with price oscillating between well-defined local swing highs near the upper boundary and swing lows anchoring the lower edge. Observable elements include a prolonged consolidation phase following an impulsive upward move earlier in the period, marked by narrowing Bollinger Bands suggesting contracting volatility, and repeated rejections at a key resistance zone aligned with the upper Bollinger Band and a descending trendline from prior highs. Volume profile indicators at the bottom reveal diminishing participation during upside probes, with liquidity pockets building below the range midpoint, hinting at potential support clusters. The overall main bias leans neutral with a bearish tilt, primarily because the failure to sustain breaks above the range top—coupled with bearish divergence on the MACD histogram—points to distribution dynamics rather than accumulation, where sellers are capping upside amid fading momentum.
Chart Read:
Delving deeper into the price action, ETH has formed a symmetrical triangle pattern within the broader range, characterized by converging trendlines from a higher swing high and lower swing low established over the past sessions. This setup exemplifies classic consolidation after volatility expansion, where the impulsive green candle runs earlier in the chart gave way to doji-like indecision candles and small-bodied red bars, signaling equilibrium between buyers and sellers. Key levels include the range top, where multiple wick rejections have formed, indicating overhead supply, and the range bottom, defended by volume spikes on green closes that suggest underlying bid liquidity. The 50-period EMA acts as dynamic support within the range, with price hugging it during pullbacks, but the steeper 200-period EMA below provides a deeper mean reversion target if breached. Absent a catalyst, this structure favors mean reversion toward the range midpoint, but watchful eyes remain on any expansion that could resolve the pattern bullishly or bearishly. The neutral-to-bearish bias stems from the lack of higher highs post-impulse, a hallmark of weakening structure in uptrends, potentially setting up for a liquidity sweep below recent lows to engineer a fakeout before reversal.
News Drivers:
With no recent news items identified in the digest, the absence of external catalysts creates a pure price action vacuum, which can amplify technical significance while suppressing volatility. This lack of headlines translates to neutral sentiment across potential themes—macro developments, project-specific updates, or regulatory shifts remain dormant, neither bolstering nor undermining ETH's trajectory. In such scenarios, the chart's bearish-leaning neutral bias stands unopposed by positive narratives, avoiding classic sell-the-news events but also missing bullish fuel from partnerships or ETF inflows that have historically driven ETH rallies. This disconnect underscores a distribution phase possibility, where price fades without fundamental backing, allowing smart money to offload into thin liquidity. Comparatively, past quiet periods for ETH have preceded range expansions tied to Bitcoin dominance shifts, but here the silence reinforces reliance on on-chain metrics like exchange inflows, which show neutral net flows absent news triggers.
Scenario Continuation:
For bullish continuation, ETH must first achieve a clean breakout above the range top with expanding volume and a momentum surge on RSI above 60, followed by a retest of that level as new support to confirm structure shift—ideally forming a higher low within the broken triangle. This would target liquidity pockets above recent swing highs, potentially accelerating toward prior impulse wave extensions if the 200 EMA flattens bullishly. Sustained closes above the upper Bollinger Band would validate this path, signaling volatility expansion and mean reversion from oversold conditions.
Scenario Invalidation:
Alternatively, invalidation of upside leans bearish if price suffers a breakdown below the range bottom, sweeping liquidity below the recent swing low and the 50 EMA confluence, potentially trapping early longs in a fakeout. This could propel toward the 200 EMA or deeper range lows, especially if accompanied by volume climax on the downside and MACD crossover to negative territory. A failure to hold the range midpoint during any pullback would accelerate this, highlighting distribution as sellers dominate amid the news void.
What to Watch Next:
Monitor volume behavior during probes at the range boundaries—spiking participation on upside breaks versus fading volume on rejections could tip the bias. Track price reaction at the range top for rejection wicks or absorption, as prolonged capping here reinforces bearish control. Observe momentum indicators like RSI for divergence resolution and liquidity sweeps below swing lows, which often precede reversals in consolidation phases. Key on-chain signals, such as net exchange flows or staking metrics, may emerge as pseudo-news in this quiet backdrop.
Risk Note:
Market structures can shift rapidly with unforecasted catalysts, and range-bound trading carries risks of whipsaws; probabilistic biases do not guarantee outcomes, emphasizing the need for robust risk parameters.
ETH's range holds the key to unlocking directional conviction in this news-quiet landscape.
#ETH #Ethereum #CryptoAnalysis"