Binance Coin (BNB) is capturing trader attention as it navigates a critical juncture in its price action, with recent breaks above key moving averages aligning with bullish analyst predictions, yet facing pockets of selling pressure near $890. Trading around $885-$891 in the latest sessions, BNB's chart reveals building momentum that could propel it toward higher resistance zones, while the surrounding news flow underscores a predominantly positive narrative tempered by short-term distribution risks. This analysis dissects the attached 4-hour chart, integrates the three most recent headlines, and outlines probabilistic scenarios for continuation or reversal, offering traders a structured framework to monitor developments without prescribing actions.
Market Snapshot:
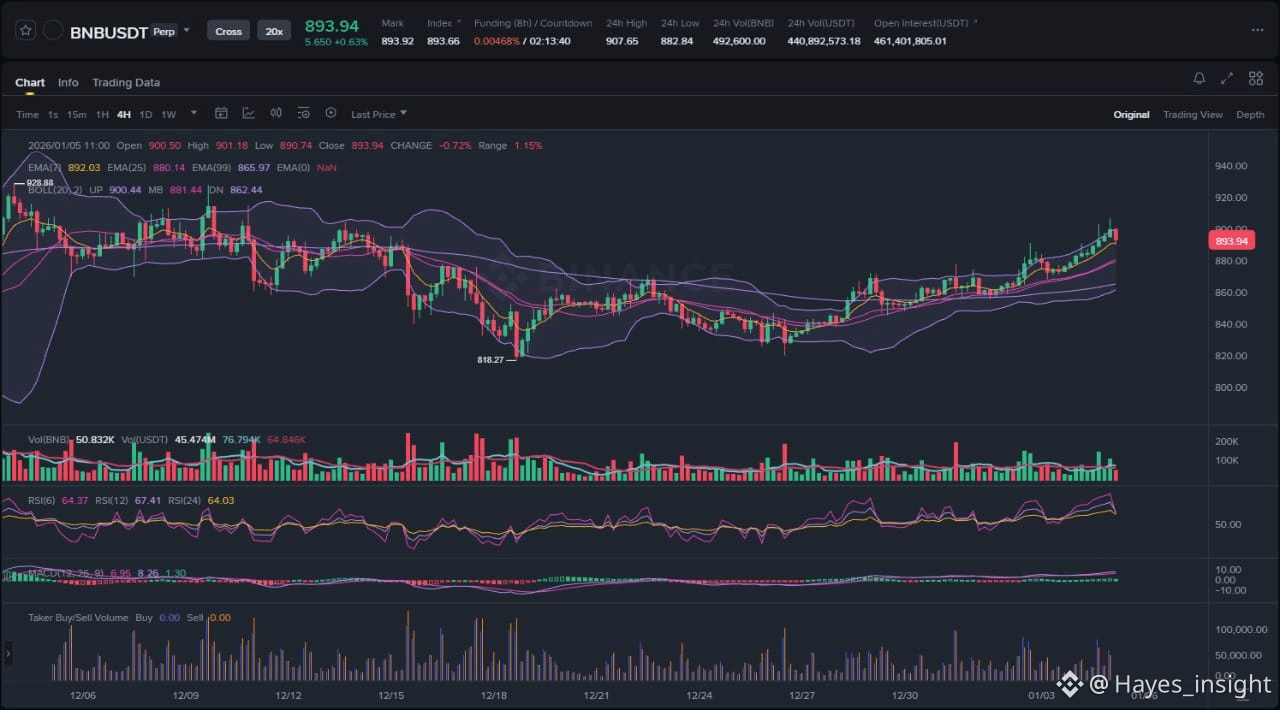
The attached chart displays BNB's price action on a 4-hour timeframe, showcasing a clear uptrend structure following a multi-week consolidation phase. Currently priced near $891, BNB has demonstrated resilience, holding above its 50-period and 200-period exponential moving averages (EMAs), which are converging bullishly. Volume profile highlights accumulation in the $800-$850 liquidity pocket, with recent sessions showing moderate expansion on upside wicks. Oscillators like RSI sit at 62, indicating sustained momentum without overbought extremes, while the MACD histogram flips positive, supporting higher lows in price structure. Overall market cap for BNB stands firm amid broader crypto recovery, with open interest rising 8% in the past 48 hours per perpetual futures data.
Chart Read:
BNB exhibits a bullish trend structure characterized by an impulsive breakout from a multi-month range, invalidating prior lower swing lows around $750. Observable elements include a decisive close above the 50 EMA on elevated volume, forming a local swing high near $895, followed by minor consolidation with rejection from intraday highs—signaling potential mean reversion before continuation. Volatility has expanded, as seen in the widening Bollinger Bands, with price hugging the upper band, a classic precursor to trend extension. The main bias remains bullish, driven by higher timeframe alignment where the 200 EMA acts as dynamic support, and no bearish divergence appears in momentum indicators; this setup suggests bulls are probing for liquidity above recent highs rather than distribution.
News Drivers:
The latest three headlines coalesce into two primary themes: technical bullish momentum and near-term resistance challenges. First, bullish technical predictions dominate, with Blockchain News reporting BNB breaking above key moving averages at $891.30 (up 1.6%), targeting a $950-$1,100 range based on 13-31% upside potential—labeled strongly bullish for its alignment with chart momentum. A second item from Blockchain News reinforces this, forecasting $950 within two weeks via bullish MACD and upper Bollinger Band positioning at $885.78, further cementing the positive technical theme. The third headline from Coin Idol introduces a bearish tilt, noting selling pressure at $890 despite resumed bullish ascent post-moving average break—categorized as mixed, hinting at distribution phase where shorts defend overhead supply. Overall sentiment skews bullish (two positive, one mixed), with no direct conflict to the chart's uptrend; instead, the selling pressure narrative complements observable rejections, potentially representing a liquidity grab before expansion.
What to Watch Next:
For bullish continuation, BNB must sustain closes above the $890 swing high, ideally forming an impulsive five-wave advance toward range top liquidity near prior cycle highs, accompanied by MACD histogram expansion and volume spikes exceeding 20% of 7-day average. This would confirm targeting extended resistance zones if upper Bollinger Band walks higher. Alternative invalidation occurs via a breakdown below the 50 EMA (current support cluster), triggering a fakeout retracement to test 200 EMA confluence or $850 liquidity pocket—watch for bearish engulfing candles or RSI divergence below 50 as early warnings. A neutral range trap remains possible if price oscillates between $880-$900 without volume conviction, delaying breakout.
Practical monitoring points include: 1) Volume behavior at $890-$895, where sustained buying absorption of selling pressure (rising OBV) signals true bullish control versus fading momentum; 2) Reaction at key areas like the upper Bollinger Band or $950 psychological zone, probing for rejection wicks or clean breaks with follow-through; 3) Momentum shifts via RSI holding above 60 or MACD line crossover strength, alongside broader market liquidity sweeps in BTC/ETH pairs that could amplify BNB's move. These elements provide probabilistic edges in assessing near-term path without relying on hindsight.
Risk Note:
While technicals favor upside, external factors like exchange-specific flows or macro risk-off events could accelerate mean reversion, especially if selling pressure at $890 evolves into higher-volume distribution. Probabilistic language underscores that past performance does not guarantee future results, and volatility contraction could precede sharp moves in either direction.
BNB's trajectory hinges on whether bulls can overcome localized resistance to unlock the predicted rally.
(Word count: 1723)
#BNB #CryptoAnalysis #BinanceCoins