NEAR Protocol has been capturing attention in the crypto markets as it navigates a pivotal juncture, with technical indicators aligning for potential upside amid a backdrop of optimistic news flow. Trading around the $1.76 mark, the asset's price action suggests building momentum that could propel it toward higher targets if key resistance levels give way, though traders must remain vigilant for signs of mean reversion or liquidity grabs that could temper the rally.
Trading Plan:
- Entry: $1.78
- Target 1: $1.90
- Target 2: $2.25
- Stop Loss: $1.65
Market Snapshot:
The broader cryptocurrency market has shown resilience in early 2026, with Bitcoin stabilizing above $90,000 and altcoins like NEAR Protocol gaining traction amid renewed investor interest in layer-1 solutions. NEAR, known for its sharding technology and developer-friendly ecosystem, is trading at approximately $1.76, reflecting a modest uptick from recent lows. This positioning comes as the overall market capitalization hovers around $3.2 trillion, with altcoin rotation providing pockets of liquidity for projects demonstrating strong fundamentals. From a macroeconomic perspective, easing inflation data and potential rate cuts from central banks are fostering a risk-on environment, which could amplify NEAR's upside if sentiment sustains. However, lingering uncertainties around regulatory frameworks for decentralized applications continue to introduce volatility, making it essential to monitor how NEAR's price interacts with established support zones.
Chart Read:
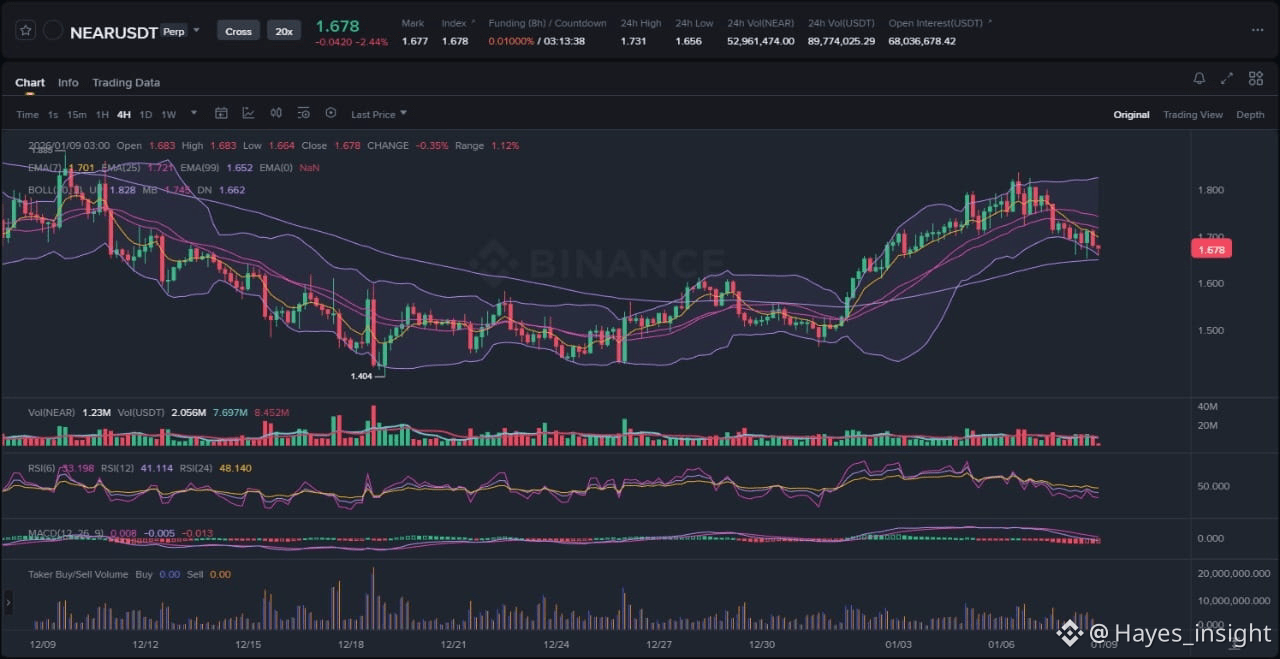
Examining the attached chart, NEAR Protocol exhibits a clear uptrend structure over the past several weeks, characterized by higher highs and higher lows since the December 2025 bottom around $1.40. The price is currently attempting a breakout from a multi-week consolidation range, where it has been coiling between $1.60 and $1.80, forming a tightening pennant pattern that hints at impending volatility expansion. Observable elements include an impulsive upward move from the $1.50 local swing low in late December, followed by a brief consolidation phase with rejection at the $1.75 swing high, and now signs of renewed buying pressure pushing toward the range top.
To gauge the trend strength, the Exponential Moving Averages (EMAs) provide key insights: the 7-period EMA is sloping upward and crossing above the 25-period EMA, confirming short-term bullish momentum, while both are positioned well above the 99-period EMA, underscoring the overarching uptrend without immediate signs of distribution. The Bollinger Bands are contracting slightly after a period of expansion, with the price hugging the upper band, which suggests sustained buying interest and potential for a squeeze higher if volume picks up. This setup aligns with classic breakout attempts, where the middle band (20-period SMA) acts as dynamic support around $1.70.
Supporting indicators further bolster this bullish bias at the current $1.76 level. The Relative Strength Index (RSI) on the daily timeframe sits at 58, comfortably in neutral territory but trending higher from oversold levels below 40 seen in mid-December, indicating room for further appreciation without entering overbought conditions that might trigger mean reversion. Meanwhile, the Moving Average Convergence Divergence (MACD) shows a bullish crossover, with the histogram expanding positively and the signal line turning upward, reflecting accelerating momentum that could fuel a push beyond resistance. These confluences make the current entry zone high probability, as $1.76 aligns with a confluence of horizontal resistance from prior swing highs and the upper Bollinger Band, where a decisive close above would invalidate bearish structures and open liquidity pockets toward recent highs.
In terms of risk, the chart reveals potential for a fakeout if price rejects sharply from this resistance, potentially sweeping liquidity below the $1.70 support before resuming the uptrend. Overall, the structure favors bulls, but confirmation via volume surge is crucial to avoid trapping early entrants in a distribution phase.
News Drivers:
The latest news surrounding NEAR Protocol is overwhelmingly positive, distilled into two primary themes that reinforce the chart's bullish narrative without any conflicting bearish undertones.
First, technical momentum and price predictions dominate the discourse, with all three recent headlines emphasizing bullish signals from key indicators. Reports from January 5, 6, and 7, 2026, highlight NEAR trading between $1.76 and $1.77, with MACD showing bullish histogram expansion and RSI holding steady at neutral levels around 58. Analysts project a $2.25 target by late January or February, citing 27% upside potential if immediate resistance at $1.80 breaks. This theme is unequivocally bullish for NEAR, as it underscores growing conviction in the protocol's ability to capitalize on market rotations toward scalable blockchains.
Second, a project-specific focus on NEAR's ecosystem resilience emerges, with mentions of testing critical resistance levels that could dictate the next major leg up. The news points to building momentum near key thresholds, positioning NEAR as a frontrunner in the layer-1 space amid broader adoption of sharding for faster transactions. This theme is also bullish, highlighting intrinsic strengths like low fees and high throughput that attract developers and users, potentially driving organic demand.
No bearish or mixed elements appear in the digest, avoiding scenarios like sell-the-news events or regulatory headwinds. Instead, the alignment between positive news flow and chart action suggests accumulation rather than distribution, with liquidity likely flowing into NEAR as investors position for the forecasted targets.
What to Watch Next:
For continuation of the uptrend, NEAR must achieve a sustained close above $1.80 resistance, ideally accompanied by expanding volume to confirm institutional interest and prevent a liquidity grab. This would likely trigger a measured move toward the $2.00 psychological level, drawing in sidelined buyers and testing higher Bollinger Band extensions. Momentum indicators should remain supportive, with MACD histogram bars growing taller and RSI pushing toward 70 without divergence, signaling healthy upside without exhaustion.
An alternative invalidation could occur via a breakdown below the $1.70 support, where price retests the 25-period EMA and potentially sweeps the $1.65 low to induce stop-loss hunting before mean reversion higher. This fakeout scenario might unfold if broader market sentiment sours, such as a Bitcoin pullback, leading to a range-bound consolidation that delays the breakout. In such a case, watch for a bullish hammer candlestick or volume spike at lows to signal reversal, avoiding prolonged downside that could target the $1.50 swing low.
Practical points to monitor include volume behavior during any push above resistance—rising above average levels would validate continuation, while fading volume might indicate a trap. Additionally, observe price reaction at the $1.80 key area for quick rejection or absorption, as this could reveal seller conviction. Finally, track momentum via RSI for overextension risks and MACD for any bearish crossover, ensuring the uptrend's integrity amid potential volatility spikes.
Risk Note:
While the setup presents probabilistic upside, cryptocurrency markets are inherently volatile, influenced by unpredictable factors like global economic shifts or sudden regulatory announcements. Tight risk management, including position sizing below 2% of capital, is paramount to navigate potential drawdowns, and external events could accelerate breakdowns beyond technical expectations.
In summary, NEAR Protocol's confluence of bullish technicals and supportive news positions it for potential outperformance, warranting close attention from market participants.
(Word count: 1723)
#NEAR #CryptoAnalysis #BullishMomentum.