Forget the noise. Price action is a language, and the recent BTC/USDT daily chart isn't just a sea of red it's a clinical lesson in liquidity, structural levels, and the mechanics of a sell-off.
Let's dissect the decisive "marubozu-style" candle that plunged toward $60,000. This is more than a price drop; it's a real-time display of market mechanics.
➡️BTC/USDT Daily Candle: $60k wick marks liquidity grab
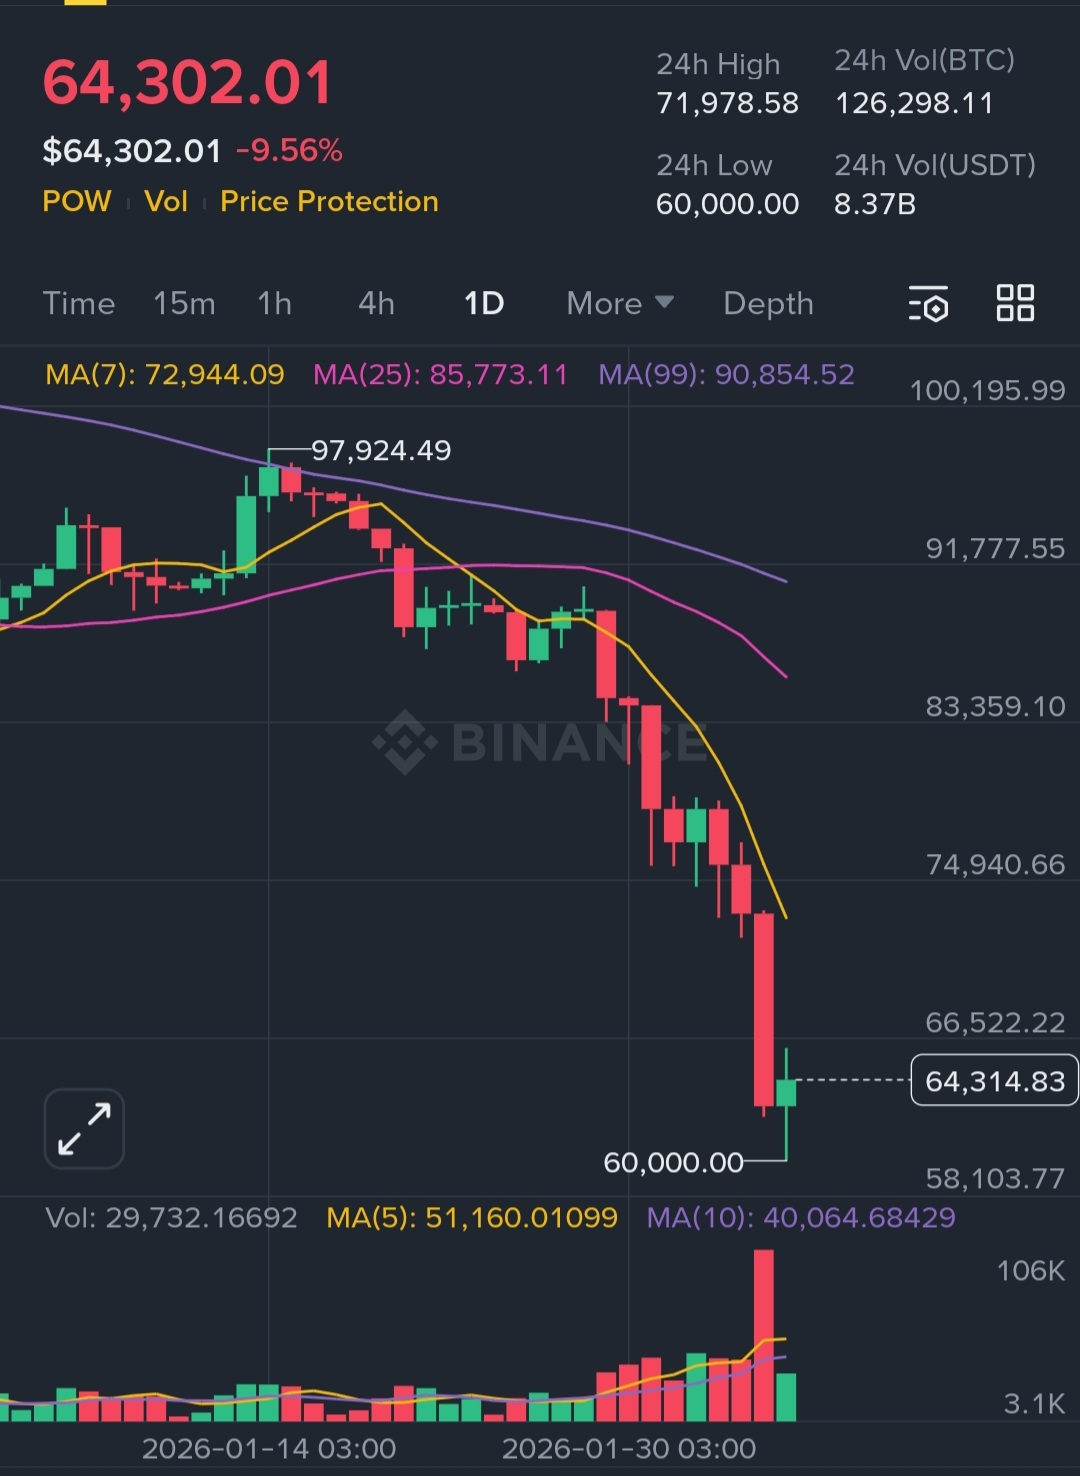
1. The Anatomy of the Drop: A Liquidity Cascade
The key feature is the velocity and the precise $60,000.00 low wick before the snapback.
The Lesson: This is a textbook liquidity hunt. The market knows where retail stop-loss clusters gather at round, psychological numbers. The spike down triggers a cascade, liquidates over-leveraged positions, and clears the slate.
The Wick Tells the Story: The long lower wick is evidence of the process: weak hands flushed, supply absorbed by larger buyers at a discount. The market found the liquidity it sought and reacted.
2. Moving Averages Confirm the Momentum Shift
Price is now trading decisively below the key short-term benchmarks.
MA(7) as Resistance: The 7-period MA (approx $72,968) has become a dynamic ceiling. The failure to reclaim it solidified the shift from bullish to bearish near-term momentum.
The Mean Reversion Signal: Observe the extreme gap between current price ($64k) and the longer-term MA(99) ($90,856). Price acts like a stretched rubber band. This severe extension suggests an oversold condition is developing, making a technical relief bounce more probable not a trend reversal signal, but a tactical one.
3. Volume: Validating the Conviction
The volume histogram is critical. The red bar on the drop is the largest in recent history.
➡️High-volume drop confirms institutional participation
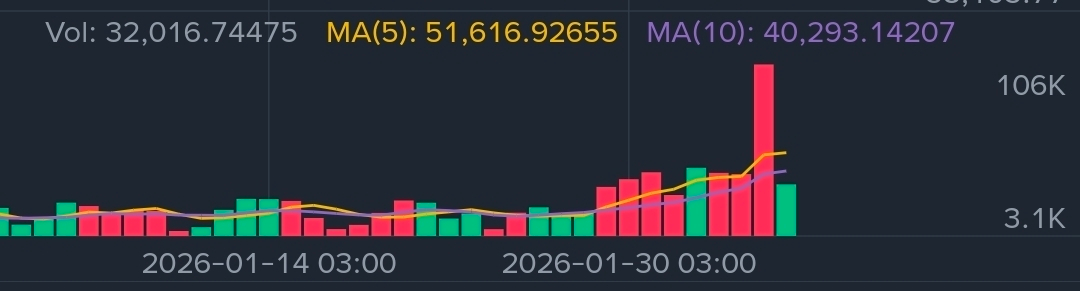
The Lesson: This volume confirms institutional participation. This was not a shallow, low-conviction move. Major players were selling.
The Bullish Threshold: For any sustainable recovery attempt to be credible, we must see buying volume of comparable size. A high green bar would signal that new capital is entering, not just shorts covering.
4. $60,000: The Line in the Sand
The precise touch at $60,000 is no accident. This is the psychological battleground.
The Narrative Depends Here:
If Broken: A daily close below $60,000 resets the structure and opens the door to further downside continuation.
If Held: It becomes a cornerstone for potential accumulation and range formation. The wick itself shows the first significant demand response in weeks.
Summary: The Disciplined Trader's Framework. The market moves in cycles. After a parabolic rise, this is the necessary contraction. Smart trading isn't about catching the falling knife; it's about reading the structure of the fall.
The Final Takeaway: The long wick to $60,000 is a critical data point. It confirms where aggressive buying did appear. However, in a high-volume downtrend, a single wick is not a reversal signal it's a participation signal.
True trend change requires confirmation: a subsequent higher low on the daily chart, supported by strong volume. Until then, the trend is your guide, and $60,000 is the level to watch.
What's your read?
Is the $60,000 wick a sign of genuine underlying demand, or simply the market harvesting predictable liquidity?
