🪙Coin Name: $AR 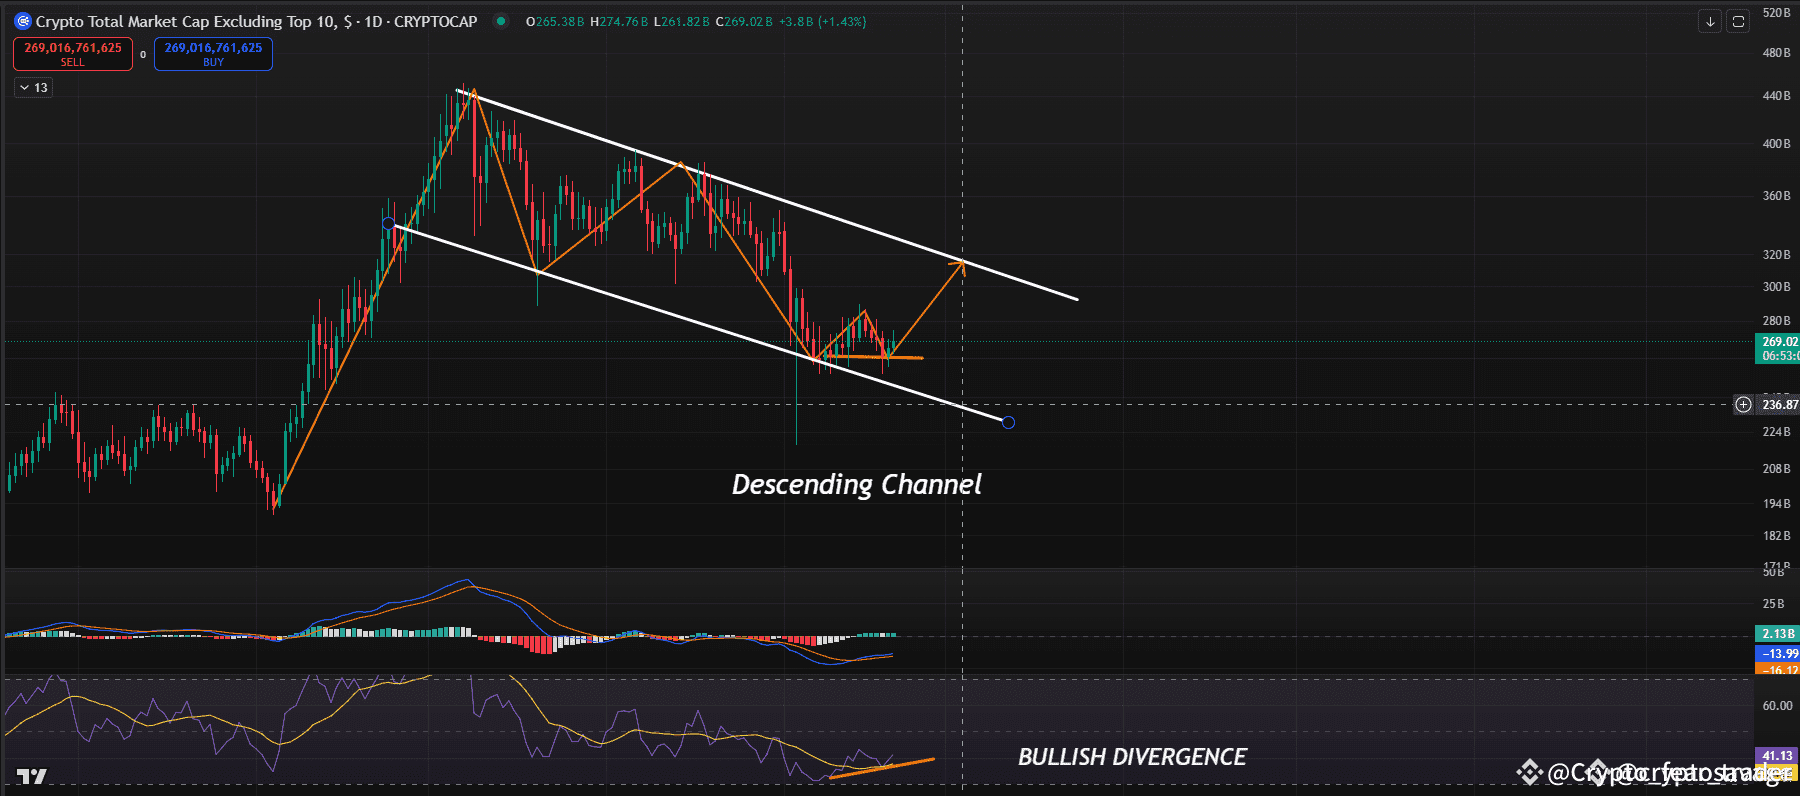
⛳️Position: Long🚀
I can see that this chart illustrates Arweave (AR) price action on the 2-hour timeframe,
$highlighting key support and resistance zones. The price recently rebounded from the support area (green) and is now testing resistance (red). After a period of consolidation with multiple peaks and troughs, a breakout above resistance could signal further upside. The orange trend line suggests a potential bullish move, anticipating retests at key levels before continuation.
Currently trading at $10.2055, the market shows bullish potential if resistance turns into support. However, given the crypto market's high volatility, this is my personal prediction. Always conduct your own research before making any trading decisions.
AR CHART PATTERN
This chart represents the total crypto market cap (excluding the top 10) on the 1-day timeframe, showing a descending channel pattern. The price has been moving within the channel, making lower highs and lower lows. However, a bullish divergence in the RSI suggests potential upward momentum. A breakout above the channel resistance could signal a trend reversal, with a possible retest of higher levels. The MACD also shows signs of recovery.
OTHERS CHART PATTERN
📥ENTRY PRICE: After breakout $10.03 or Market Price. ( Always use the DCA method )
🎯Targets:
🥇1st TP $10.6871
🥈2nd TP $11.5846
🥉3rd TP $13.4045
📌 Special Note:
🔥Spot Call🔥
⚠️ Use only 10% of your portfolio 💼 to manage risks effectively. Avoid high leverage 🚫 and proceed cautiously to mitigate potential losses 📉. Always prioritize risk management and use the DCA method ✅.

This signal is only for spots if you want future signals join my binance live.
Just click on my profile to join my live.#BinanceAirdropAlert #BinanceAlphaAlert #FTXrepayment #TradeFiRevolution #JobMarketAnalysis $BTC