Staring at this seasonality grid reveals what most miss: Bitcoin operates in probabilistic clusters, not random walks.
High-probability setups from the data:
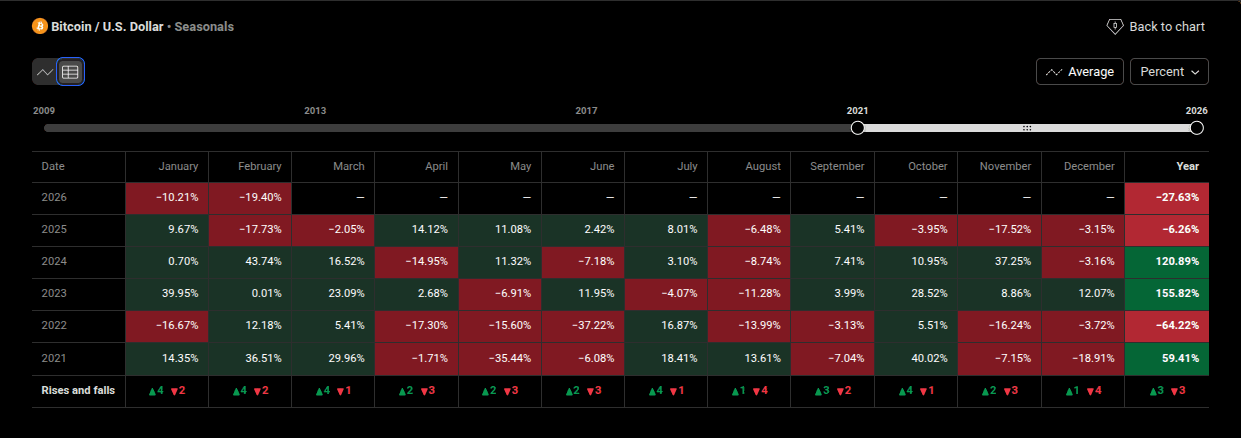
• October "Crypto Spring": 4/5 years positive (2021-2025 avg: +20%+)
• August weakness: Consistent underperformance across cycles (4/5 years negative)
• Q4 strength: When BTC closes green in October, November-December follow through 80% of time
Current regime: We're in the "post-halving hangover" phase. Pantera Capital notes the duration of current drawdown now aligns with 2018/2022 bear markets (12-14 months), suggesting significant compression has already occurred .
Risk management note: Short-term holder capitulation in November 2025 was the largest in Bitcoin's historically a contrarian buy signal.
Charts don't predict. They inform risk decisions.
Why Bitcoin Seasonality Matters in 2026
Most traders focus on daily candles. Professionals study monthly regimes.
What this 5-year matrix reveals:
Phase 1 (2021): Peak euphoria. ATH in November, followed by immediate -18.91% December reversal. Classic blow-off top seasonality.
Phase 2 (2022): Capitulation. June's -37.22% marked the Terra/Luna cascade. August and September continued lower—textual bear market seasonality.
Phase 3 (2023): Recovery. January +39.95% started the year, but notice the pattern—weak August (-11.28%), strong October (+28.52%). Cycle repetition.
Phase 4 (2024): Institutionalization. February's +43.74% was the ETF effect. November +37.25% was the Trump/policy pivot.
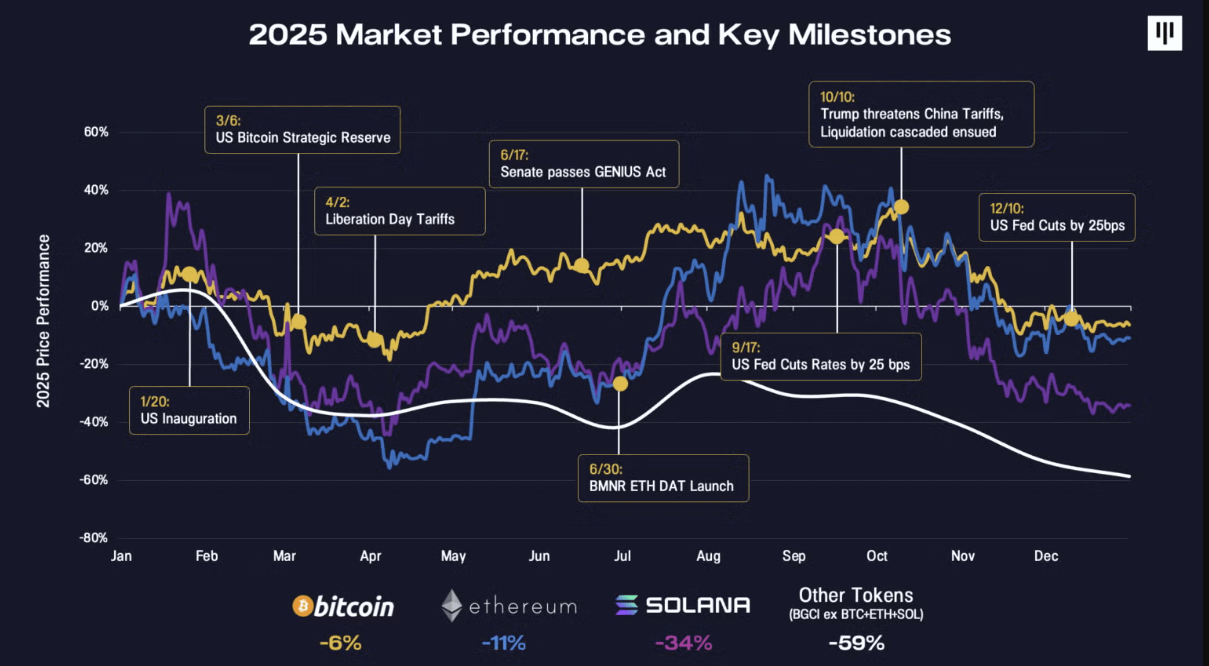
Phase 5 (2025): Consolidation. Mixed signals, -6.26% annual return. Rotation away from crypto into gold/quantum themes.
Phase 6 (2026): Current test. -19.40% February following -10.21% January. This mirrors 2022's opening but with different structural underpinnings.
The edge: Seasonality isn't prediction it's probability weighting. When technicals, sentiment (extreme fear), and seasonality align, risk/reward shifts.
