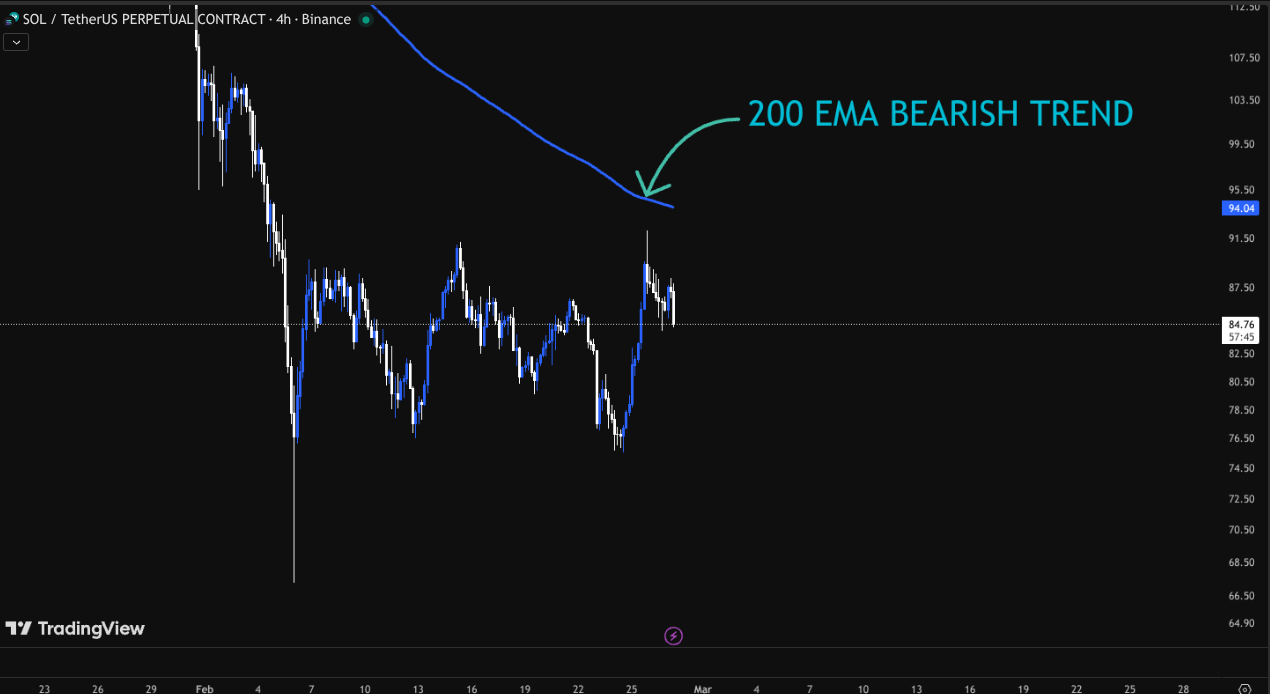
1️⃣ Trend Direction (4H + 200 EMA)
Let’s start $SOL Chart with simple Indicator.
On the 4-Hour (4H) timeframe, the 200 EMA is above the current price.
👉 When price stays below the 200 EMA, it usually means the trend is bearish (downtrend).
So overall, $SOL is still in a downtrend.
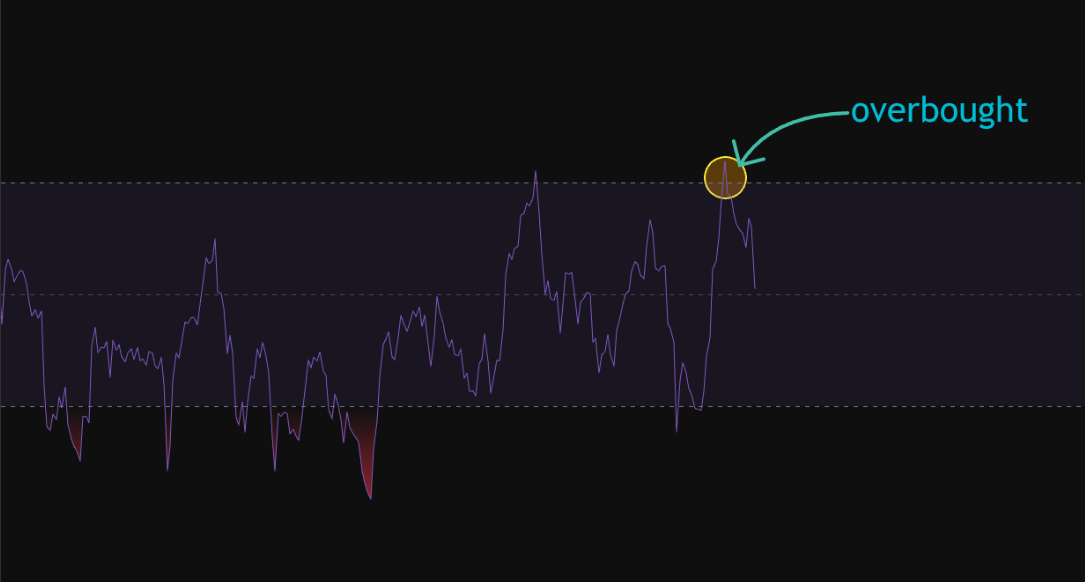
2️⃣ RSI Signal (Momentum Indicator)
The Relative Strength Index (RSI) on 4H recently entered the overbought zone (above 70) and then started moving down.
What does this mean?
When RSI goes above 70 → the market may be overbought.
When it turns down from there → it often signals a cool-down or possible drop.
This supports the bearish idea.
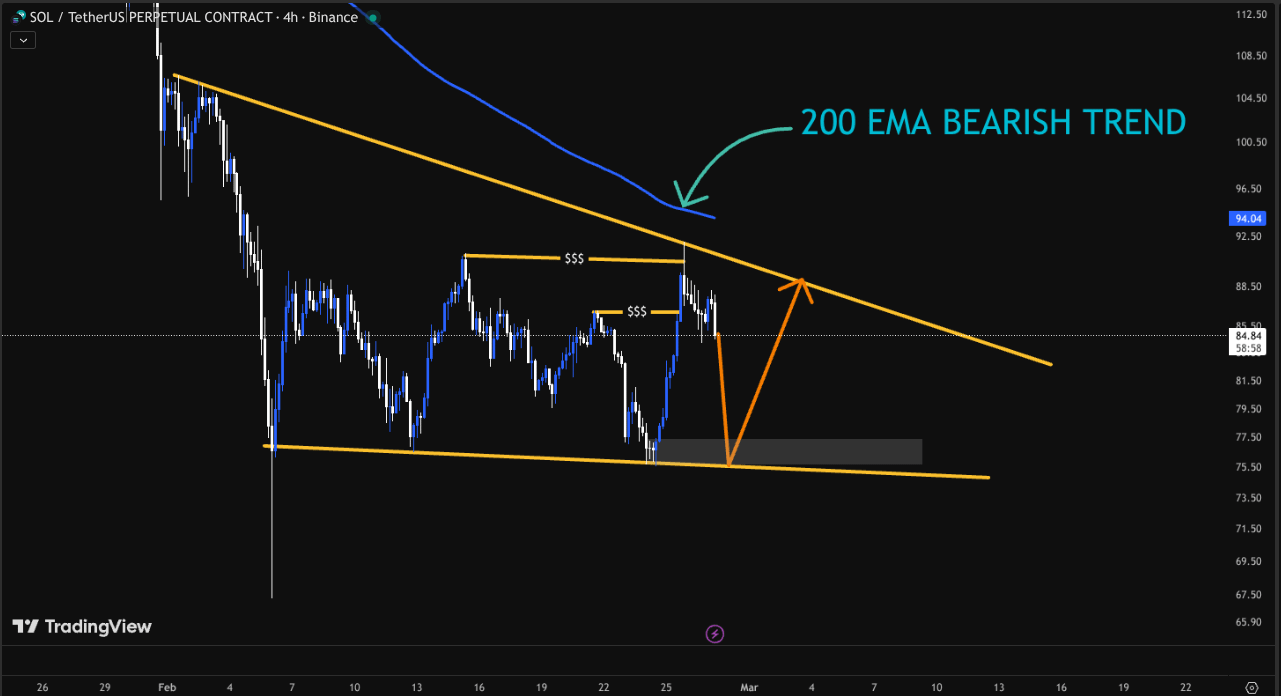
3️⃣ Market Structure & Channel
Looking at the 4H structure:
Price swept two previous highs (liquidity grab).
It touched the resistance trendline of a descending channel.
Then it formed a bearish rejection candle (long upper wick).
👉 A rejection candle at resistance shows sellers are active.
👉 In a descending channel, price usually moves from resistance back toward support.
So the next possible target could be the $76.68 support level of the channel.
4️⃣ What This Means
When we combine everything:
Price below 200 EMA → bearish trend
RSI reversing from overbought → downside momentum
Rejection at channel resistance → sellers defending
📉 All signals together suggest bearish continuation unless structure changes.
Important Reminder ⚠️
Stay away from hype.
Recently some people were saying:
“SOL will hit $100 soon”
Others saying “SOL is going to $9”
Both are emotional extremes.
📌 As traders, we follow structure and confirmation, not hype.
