

BNB is currently trading near $618, showing short-term weakness but approaching an important support zone. Here is a multi-timeframe analysis (1H, 4H, Daily) based on the charts.
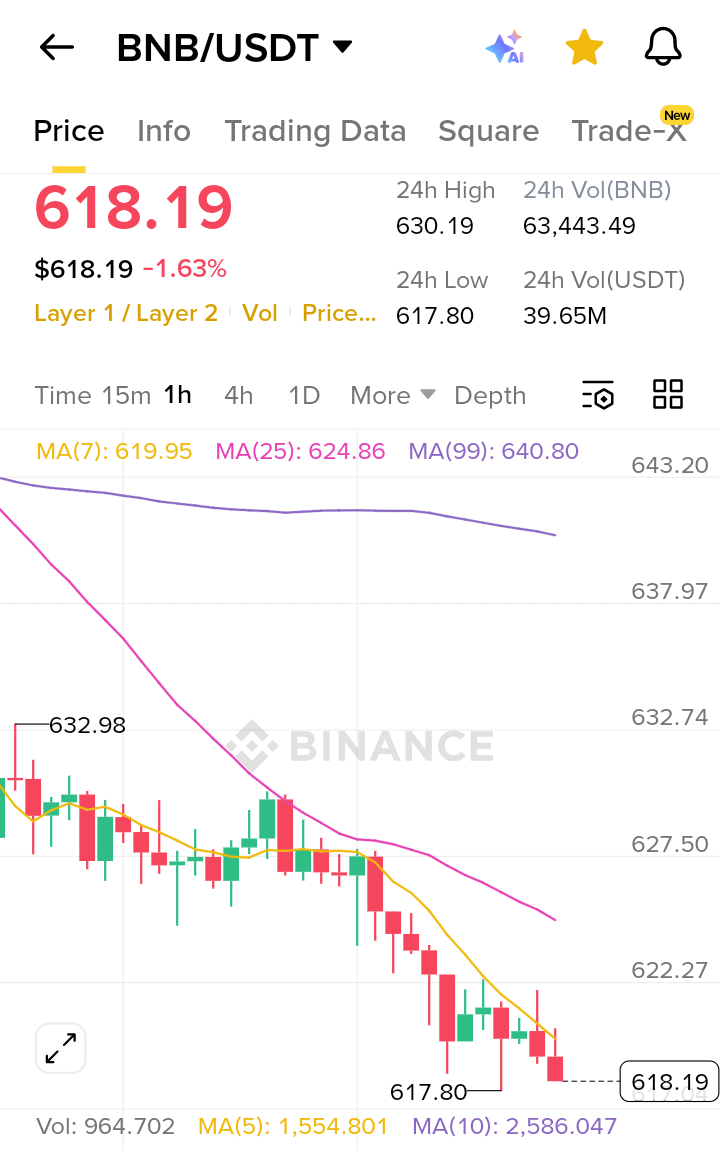
⏱ 1 Hour Timeframe – Short Term Pressure
Observation
Price is making lower highs and lower lows.
MA7 below MA25 → short-term bearish momentum.
Price trading near MA99 support (~$617-$620).
Scenario
If $617 support holds, BNB may bounce toward $625–$630.
If $617 breaks, liquidity sweep toward $610–$605 is possible.
Short term outlook: Bearish but near support bounce zone.
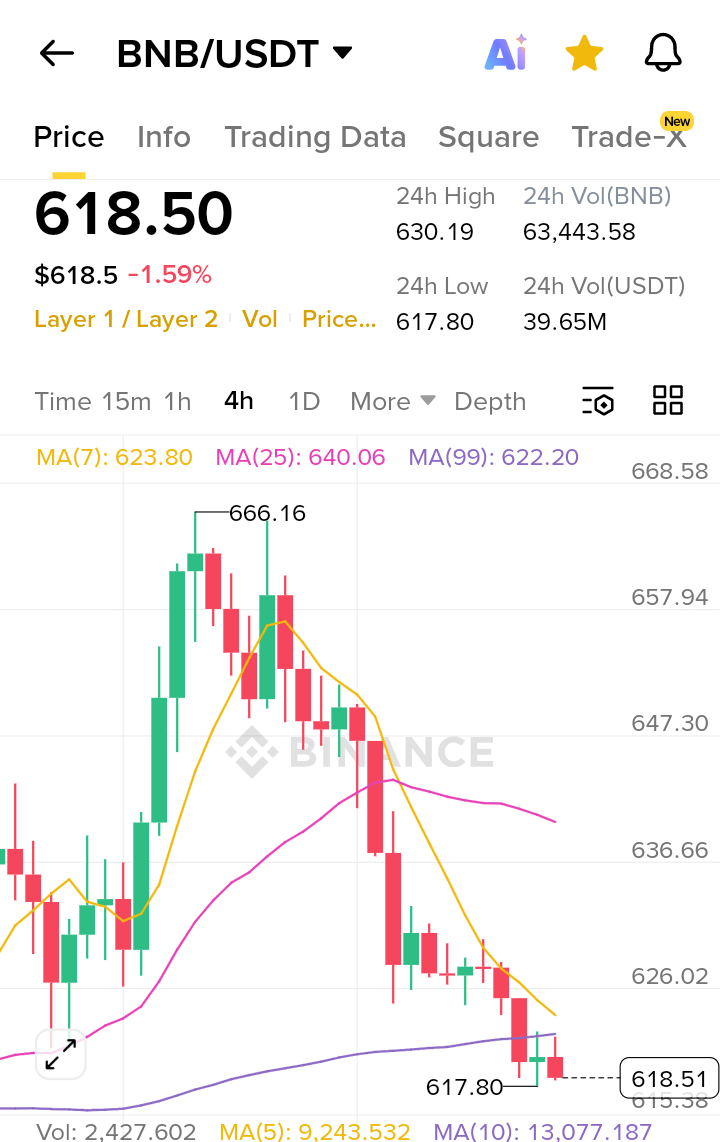
⏱ 4 HOUR TIMEFRAME – CORRECTION PHASE
Observation
Strong rally earlier toward $666, followed by steady correction.
Price currently testing MA99 support around $620.
Sellers losing momentum as candles shrink.
Scenario
Bullish case
Hold $615–$620 support
Bounce toward $635 – $645
Bearish case
Break below $615
Next liquidity zone $600–$605
Mid-term trend: Healthy pullback after rally.
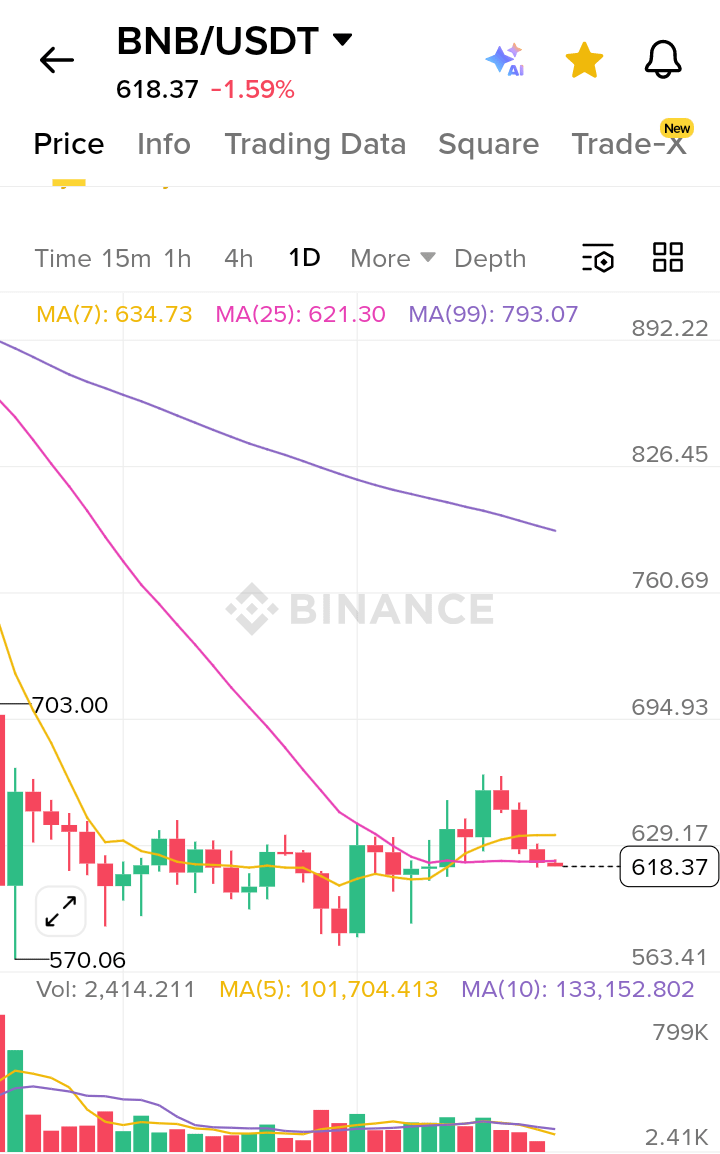
📅 Daily Timeframe – Market Structure
Observation
Daily structure still sideways to slightly bullish.
Strong historical support around $600–$605.
Current move looks like normal retracement within range.
Key levels:
Support
$615
$600
Resistance
$635
$660
📊 Best Spot Buy Strategy
🟢 Strategy 1 – Support Entry
Buy zone
$615 – $620
Targets
$635
$650
Stop loss
$608
🟢 Strategy 2 – Liquidity Sweep Entry (Safer)
Wait for a dip into:
$600 – $605
Targets
$630
$660
This zone historically attracts strong buyer liquidity.
🟢 Strategy 3 – Breakout Entry
Buy only if BNB reclaims:
$635
Targets
$660
$680
⚡ Quick Summary
• Short term → bearish pressure
• Mid term → correction phase
• Long term → strong support near $600
BNB is currently sitting at a key accumulation area, and a liquidity sweep below $615 could trigger the next upward move.