BTC/USDT – Daily Analysis for Traders (1D Chart) 📊
Pair: BTC/USDT
Timeframe: 1 Day (1D)
Market Trend: Bullish Bias 📈
Market Overview:
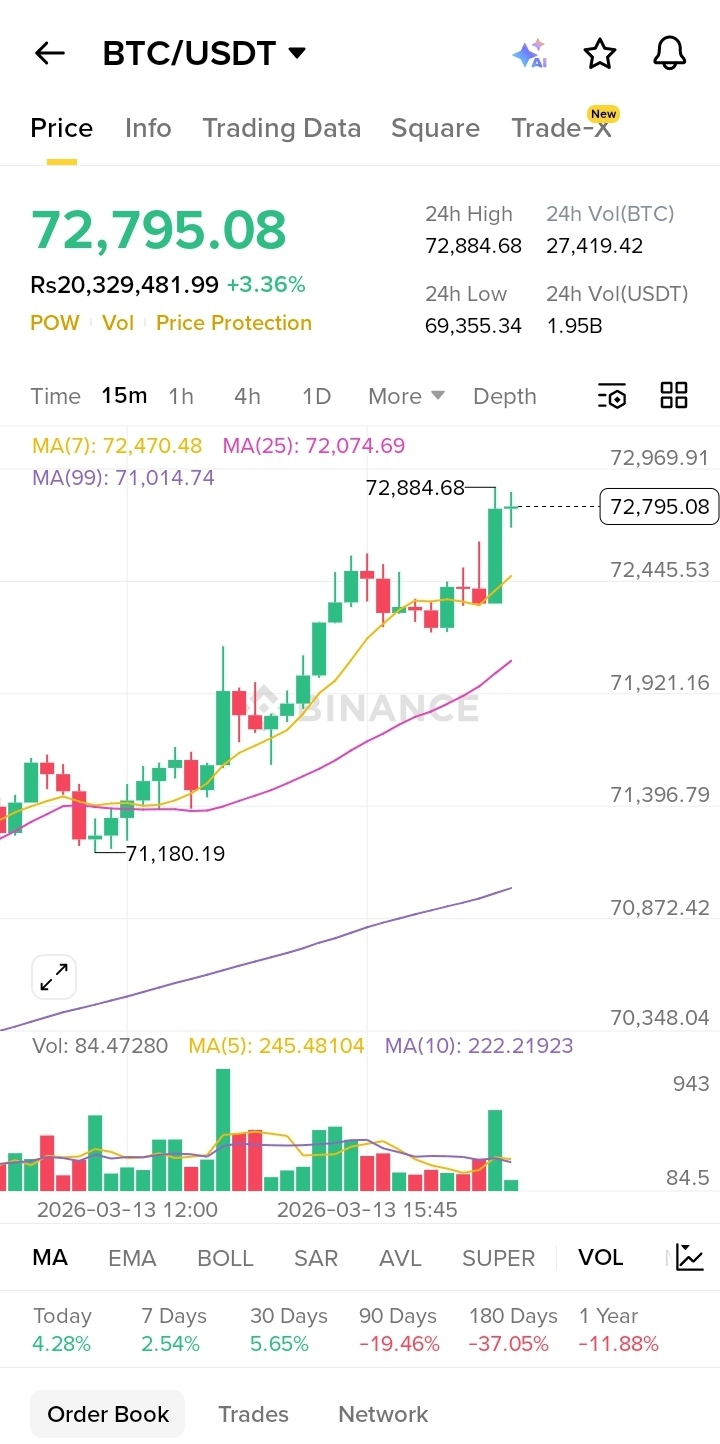
Bitcoin continues to show strong market interest on the daily timeframe. The price structure indicates higher highs and higher lows, suggesting that buyers are still active. If BTC maintains support above key levels, the bullish momentum could continue.
Key Support Levels:
65,000 USDT
63,500 USDT
Key Resistance Levels:
68,000 USDT
70,000 USDT
Technical Indicators:
Moving Averages: BTC price is trading above the short-term moving averages, indicating positive momentum.
Volume: Stable trading volume suggests continued participation from buyers.
Momentum: A breakout above 68K could push the price toward the 70K psychological resistance level.
Trading Setup (Educational):
Buy Zone: 65,500 – 66,500 USDT
Target 1: 68,000 USDT
Target 2: 70,000 USDT
Stop Loss: 63,500 USDT
⚠️ Disclaimer: This analysis is for educational purposes only. Always manage risk and do your own research before trading.#BTC