Bitcoin $BTC price is currently around $71,300 USD, up +2.5% in the last 24 hours and has officially broken above $73,800. This is the weekly high, but it's still down roughly 42-47% from the previous cycle peak (around $126k in October 2025).
1. Chart & Technical Analysis
- Strong Death Cross on the 3D timeframe: The SMA 50 has crossed below the SMA 200 → a historic bearish signal (in past cycles, it preceded drops of ≥50%). Price is currently testing the weekly EMA200 (the red line).
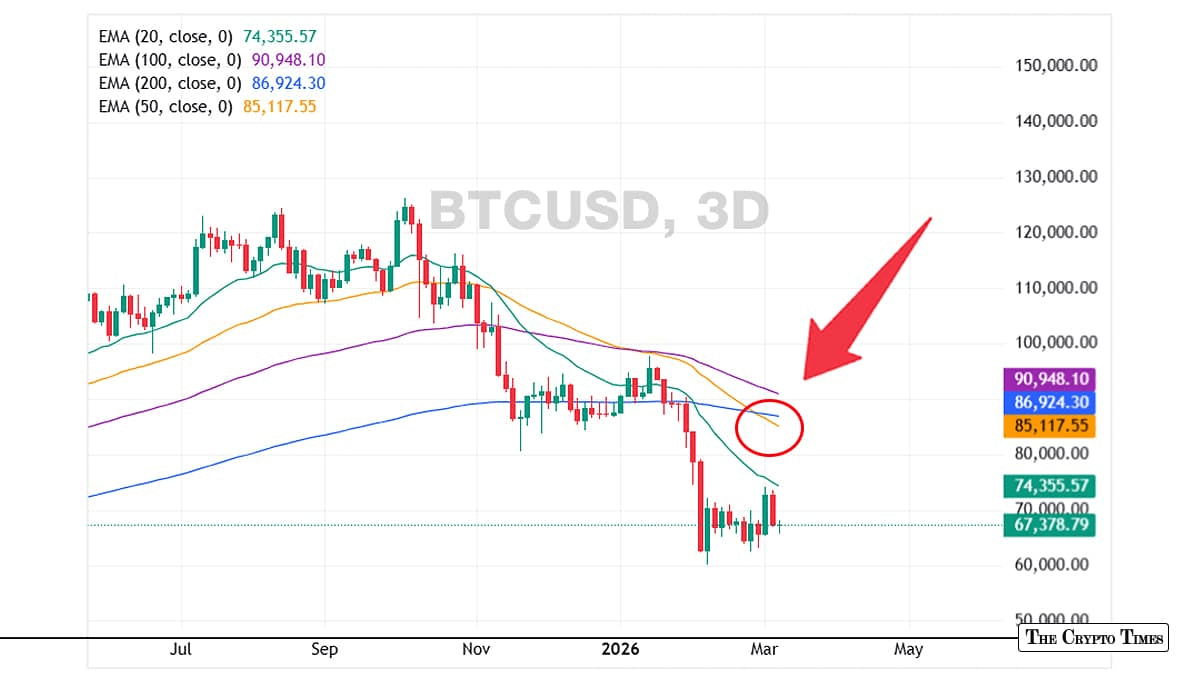
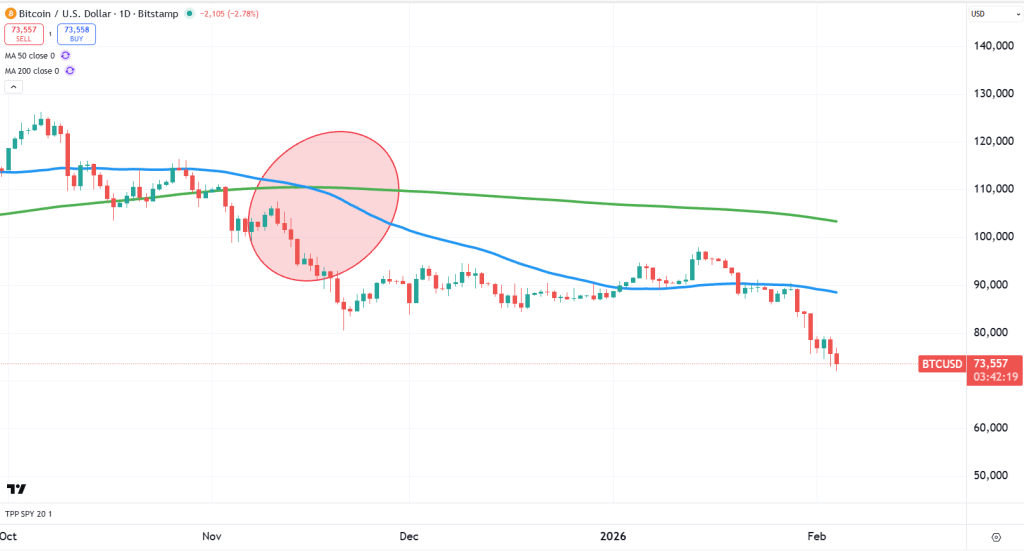
This pattern has historically signaled the final leg down in bear markets.
- Current Pattern: Price is in a bullish triangle (ascending triangle), but overall structure remains lower highs + lower lows (bearish trend). Key support: 68k–70k (multi-tested zone). Nearest resistance: 73k–75k, then 80k.
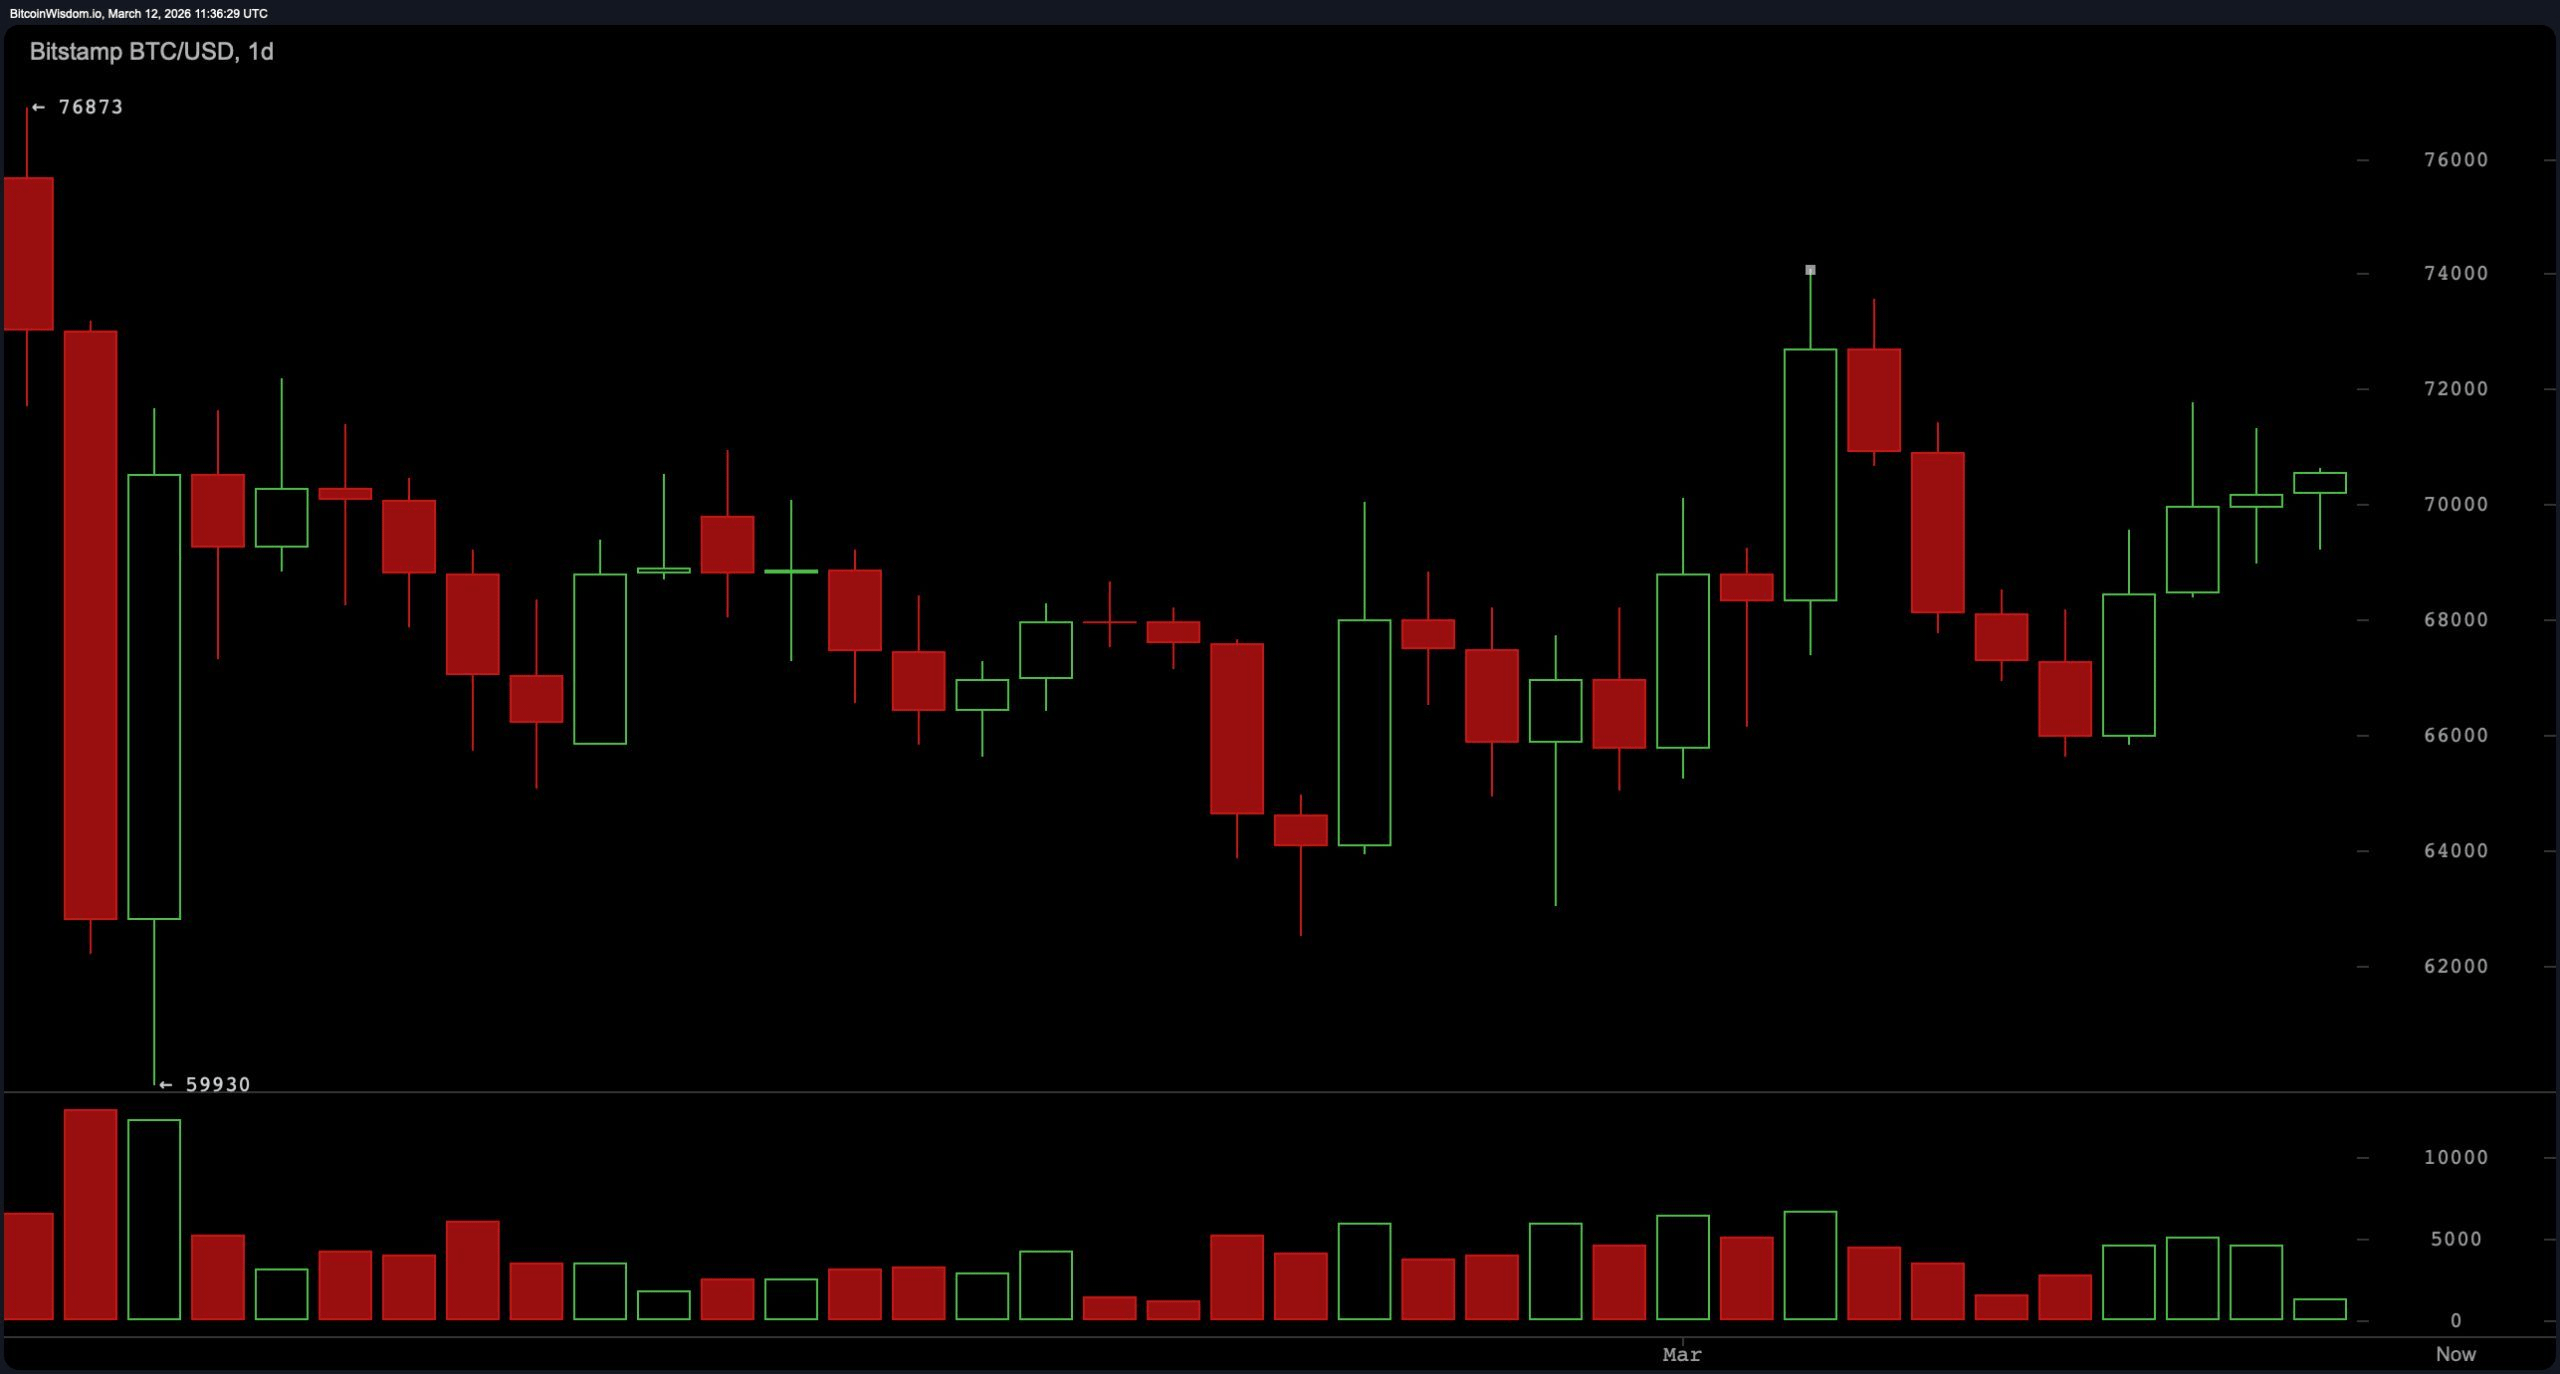
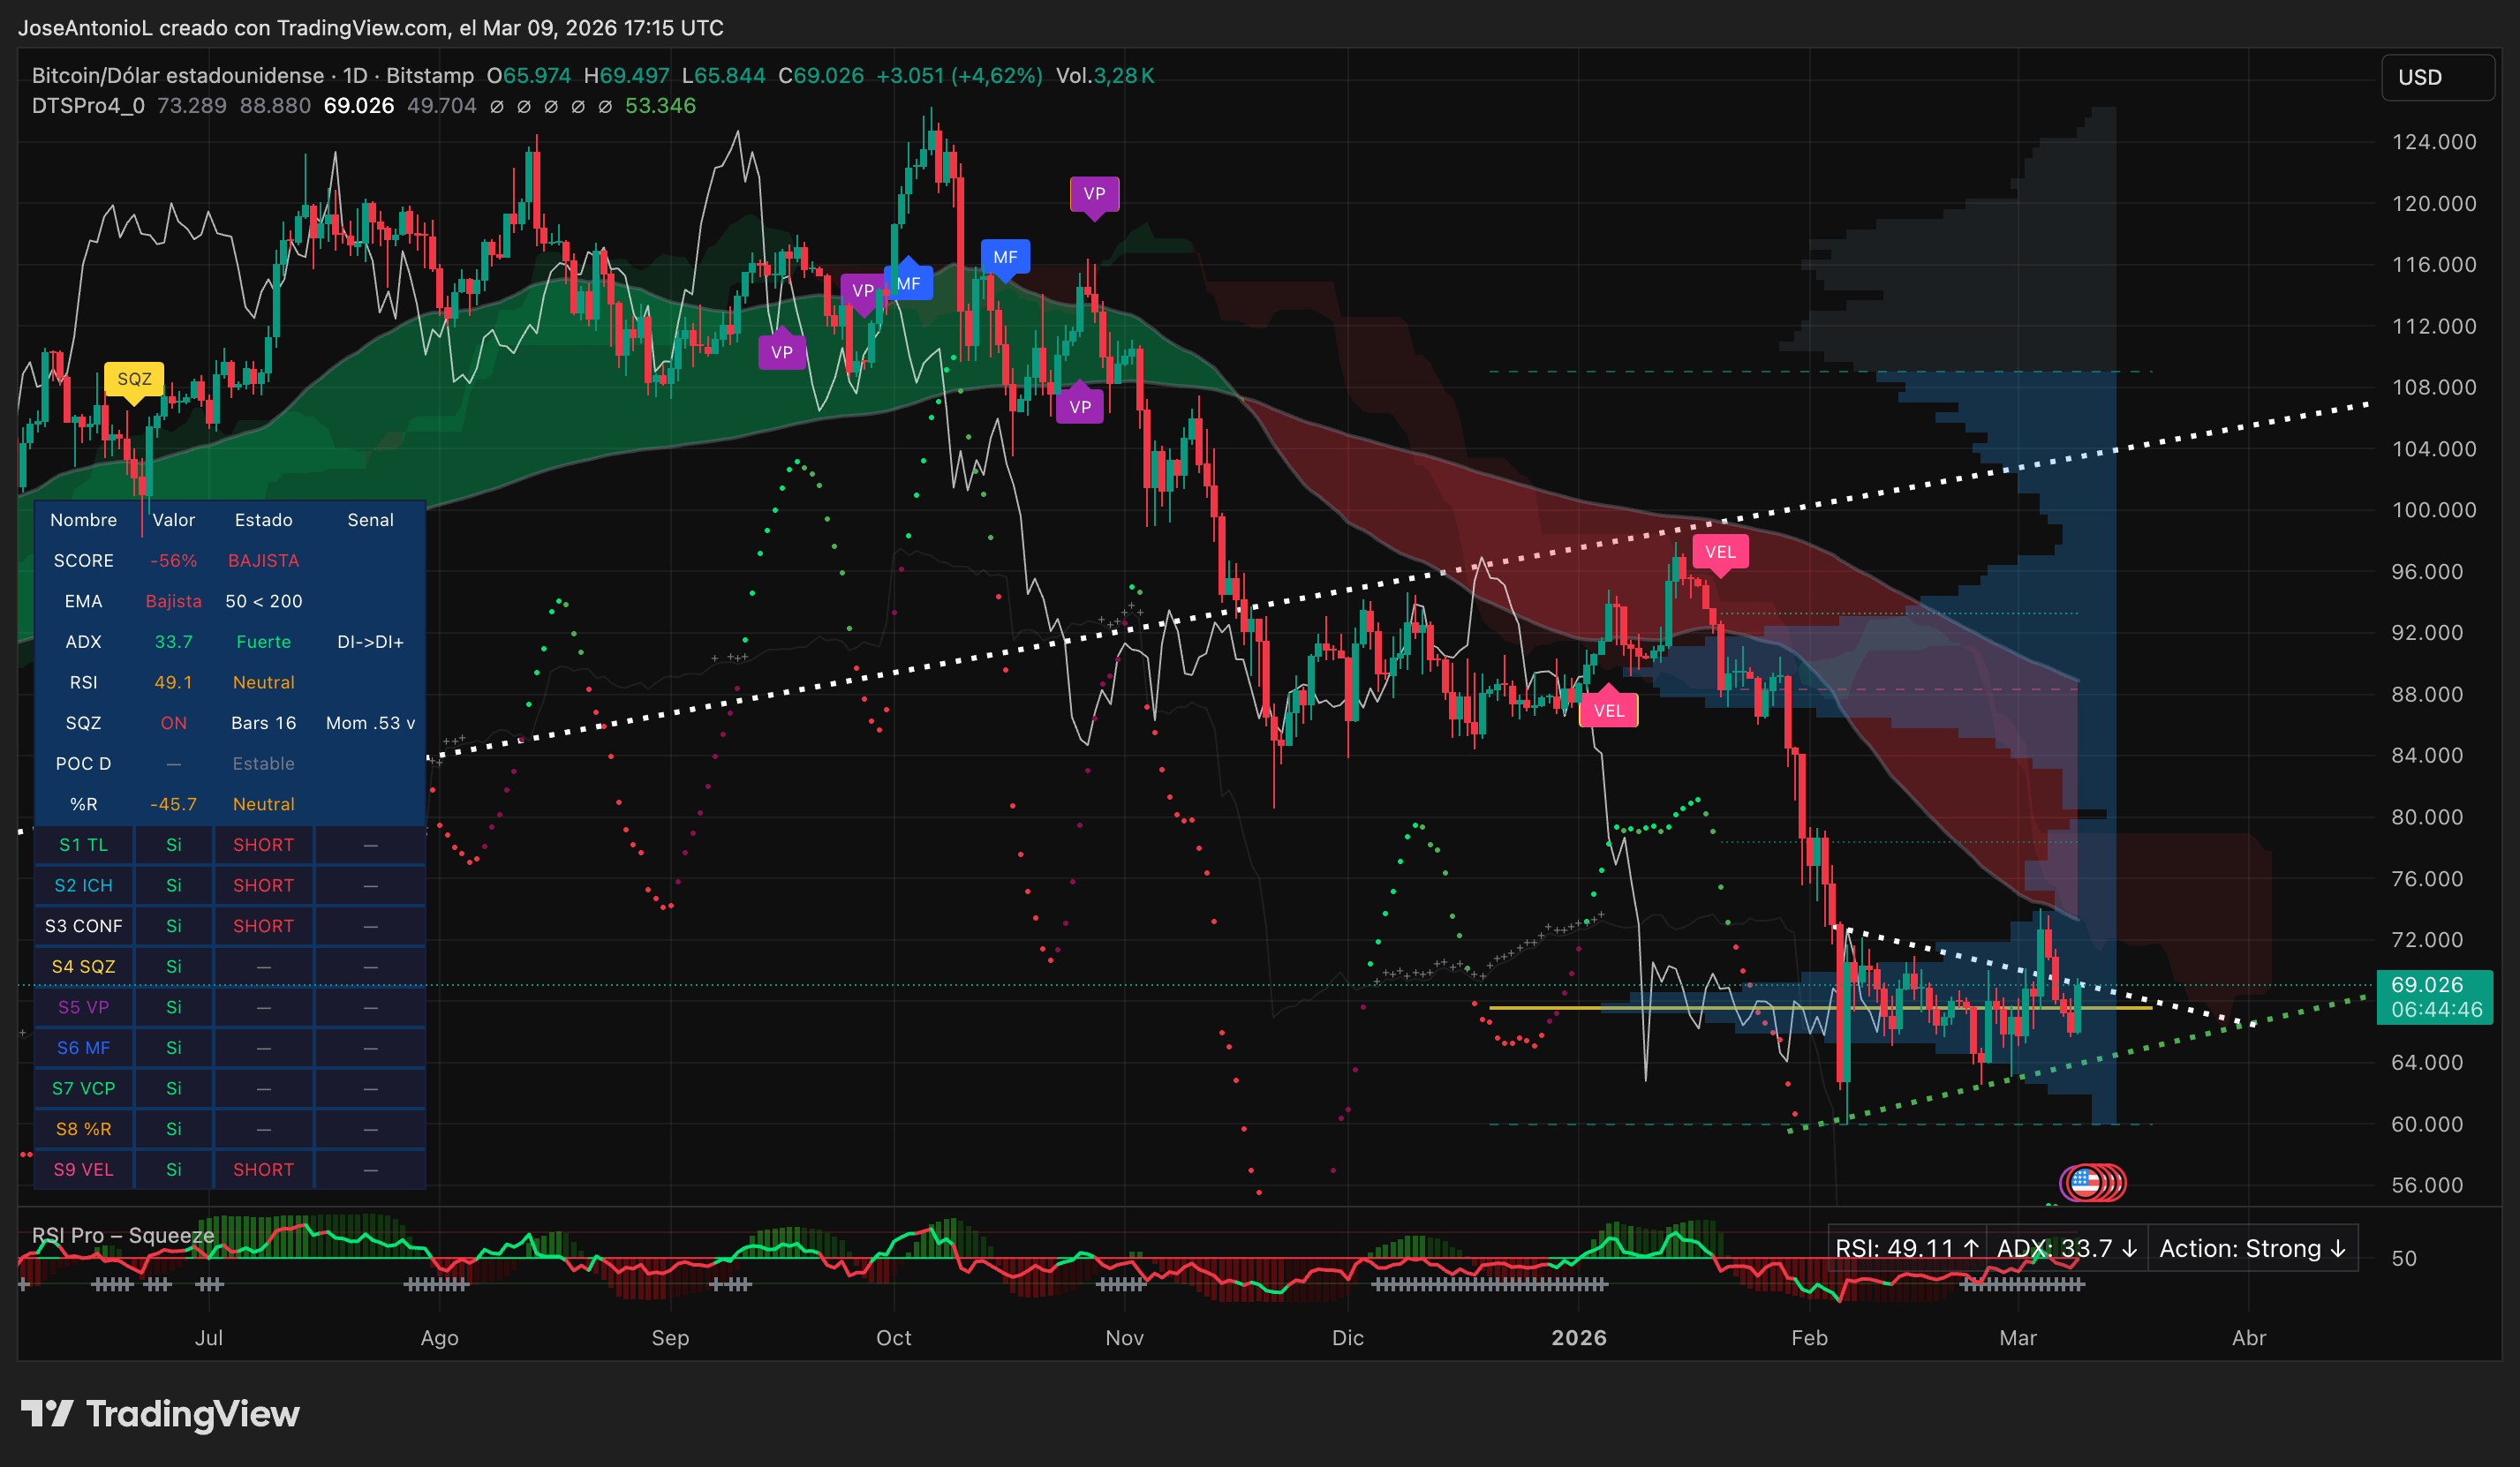
Technical conclusion: This is an attempt at trend reversal, but neutral-to-bearish signals dominate. If it holds above 70k and breaks 75k, a new uptrend could start; otherwise, it risks retesting 60k–55k.
2. On-Chain Analysis (Glassnode, CryptoQuant)
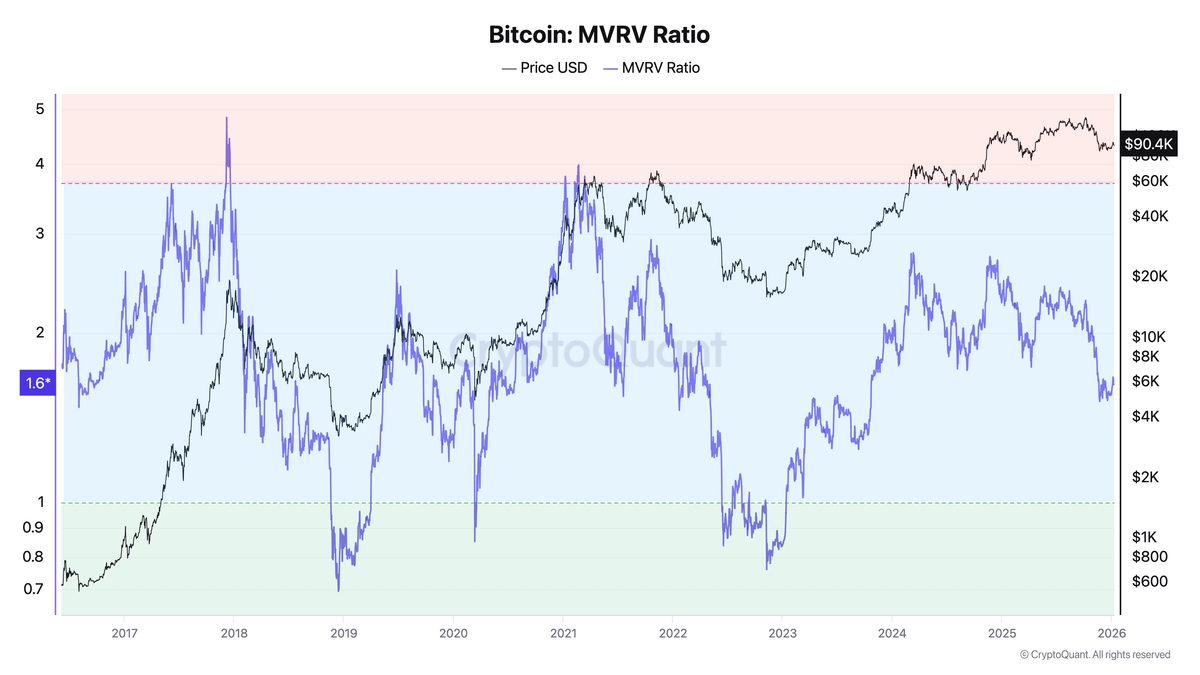
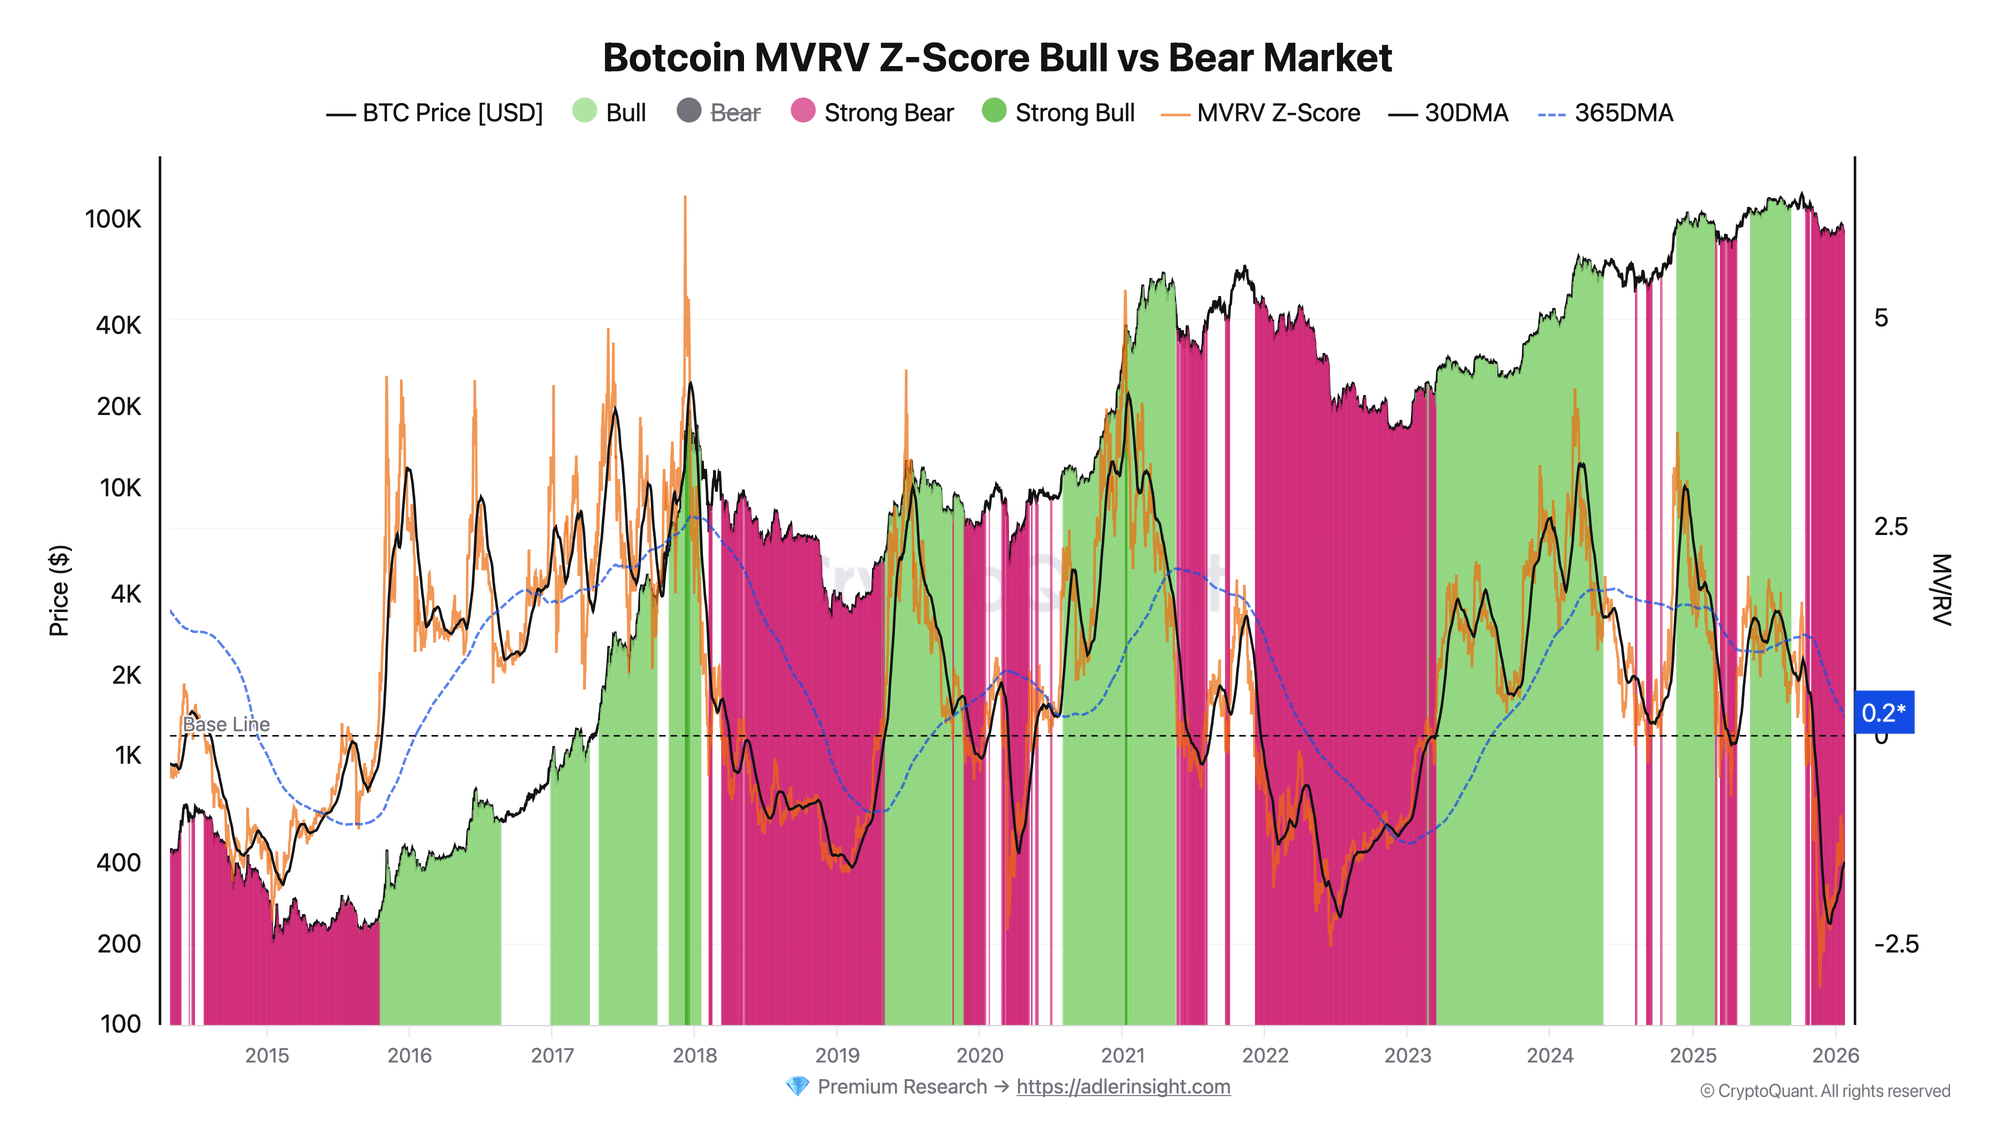
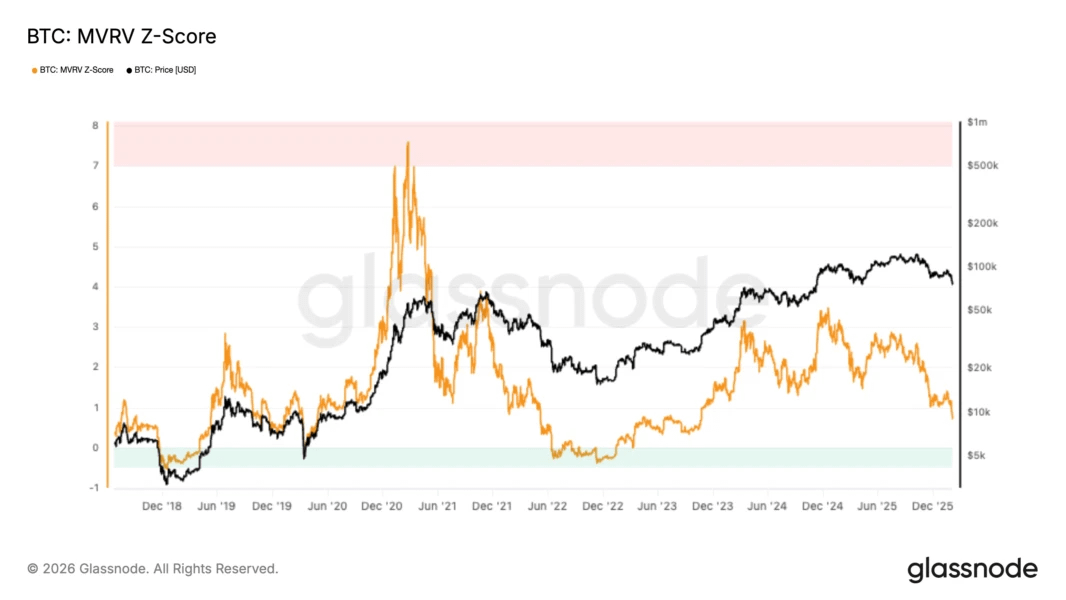
- MVRV Ratio & Z-Score: Currently low (~1.2–1.6), similar to 2022 bottom levels. Z-score is at a strong oversold extreme (near 0.2) → market appears undervalued, but not yet at full capitulation extremes like previous bottoms.
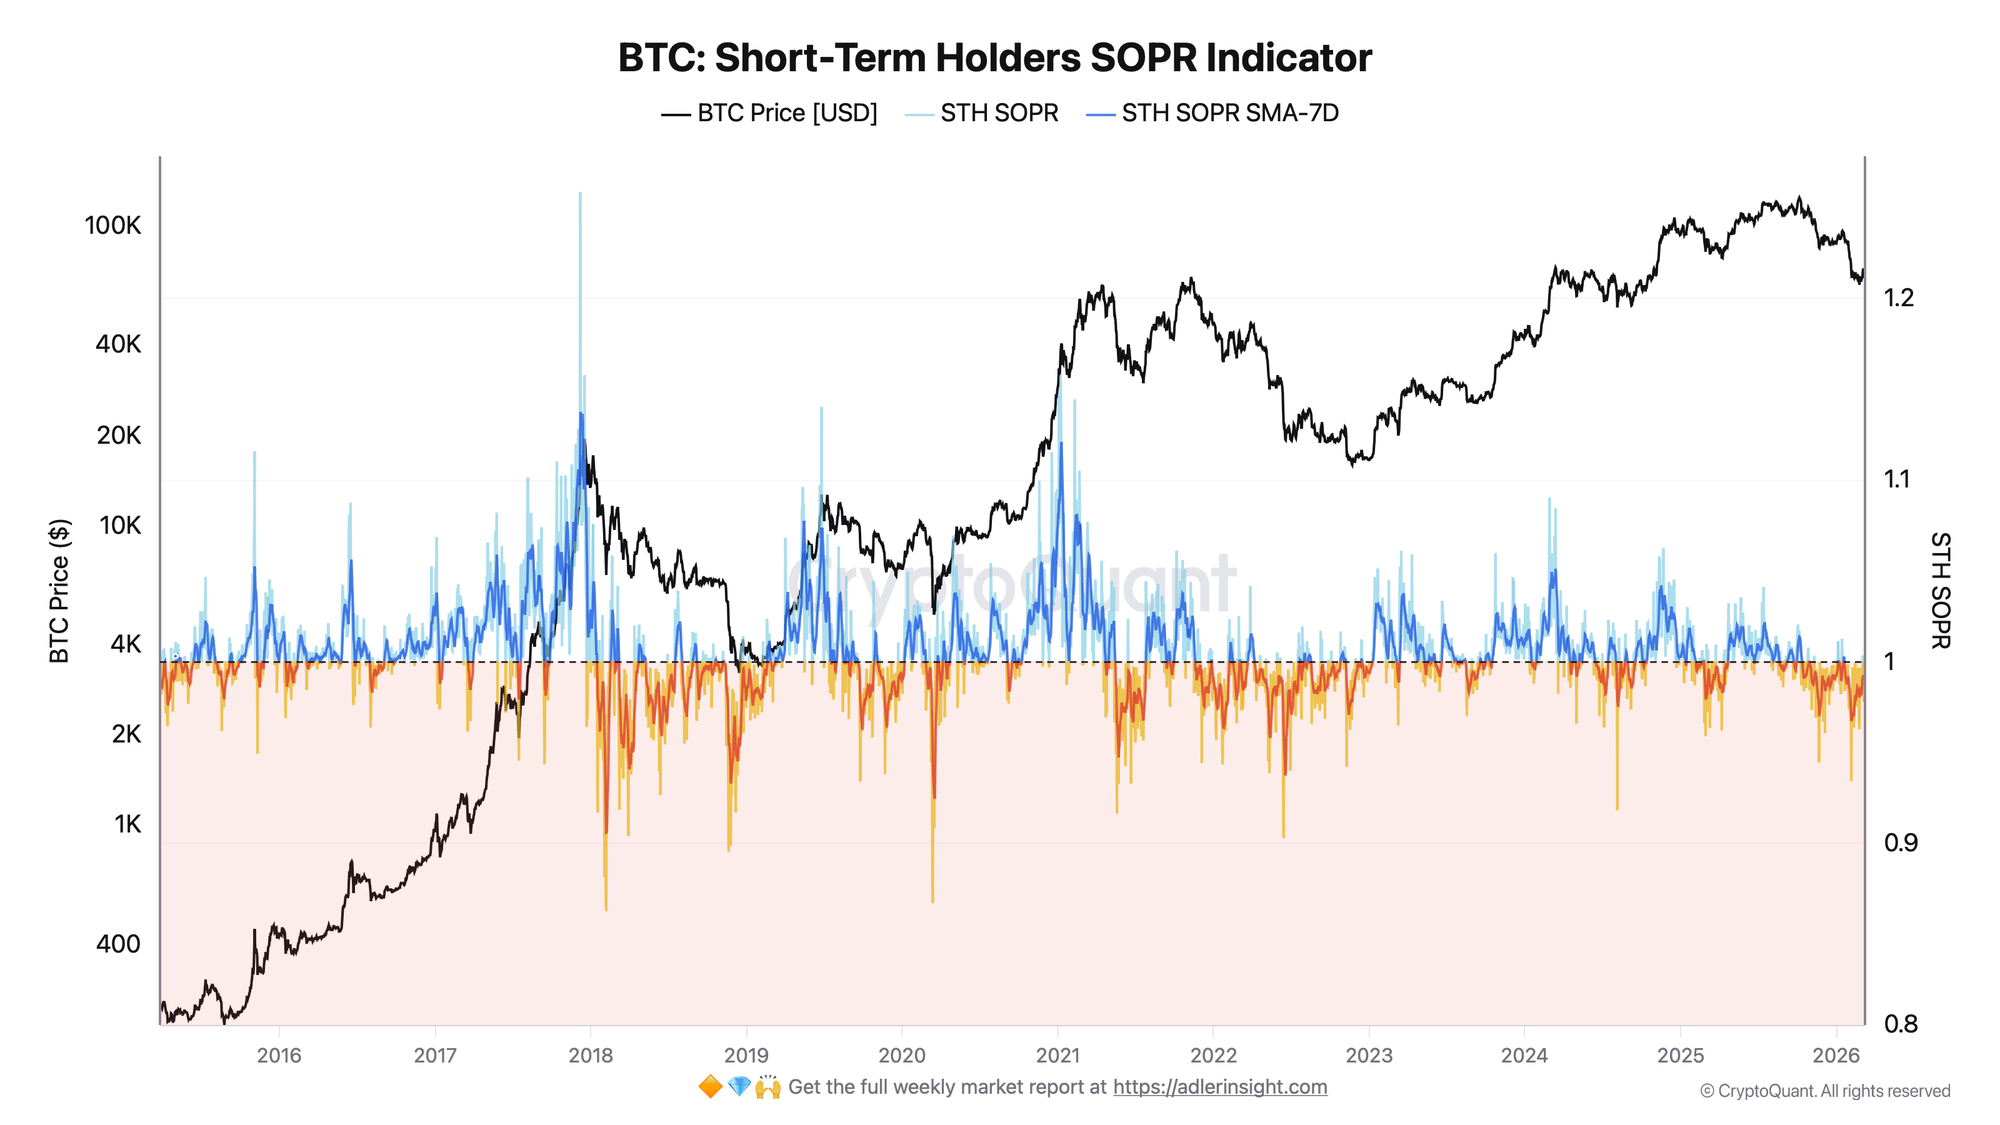
- SOPR & Realized Profit/Loss Ratio:
- Overall SOPR is below 1 (holders selling at average loss).
- 90-day SMA of realized P/L has been below 1 since Feb 21 → historically (per Glassnode), it takes another 5–6 months to return above 1 (meaning pain could continue until around Aug–Sep 2026).
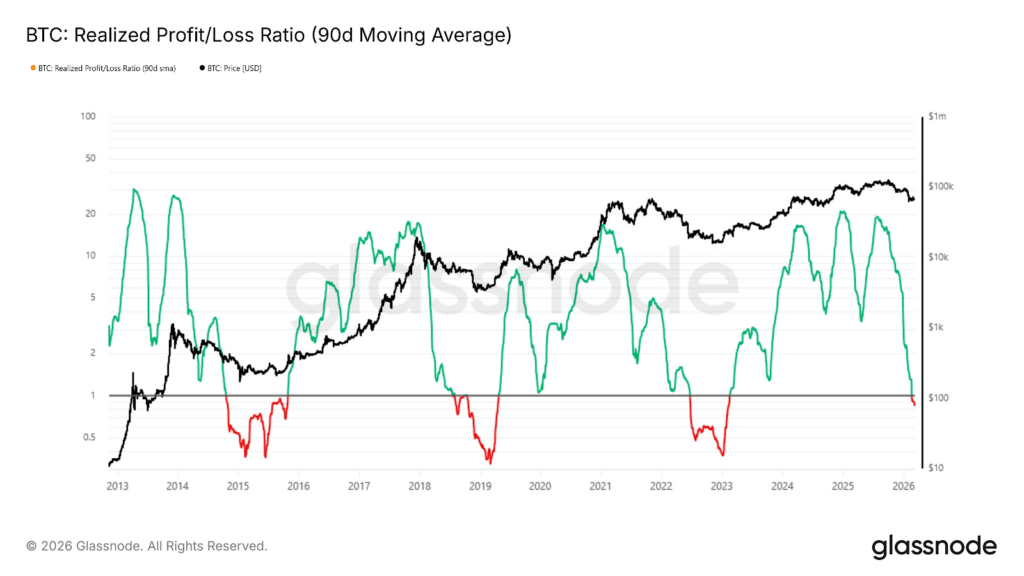
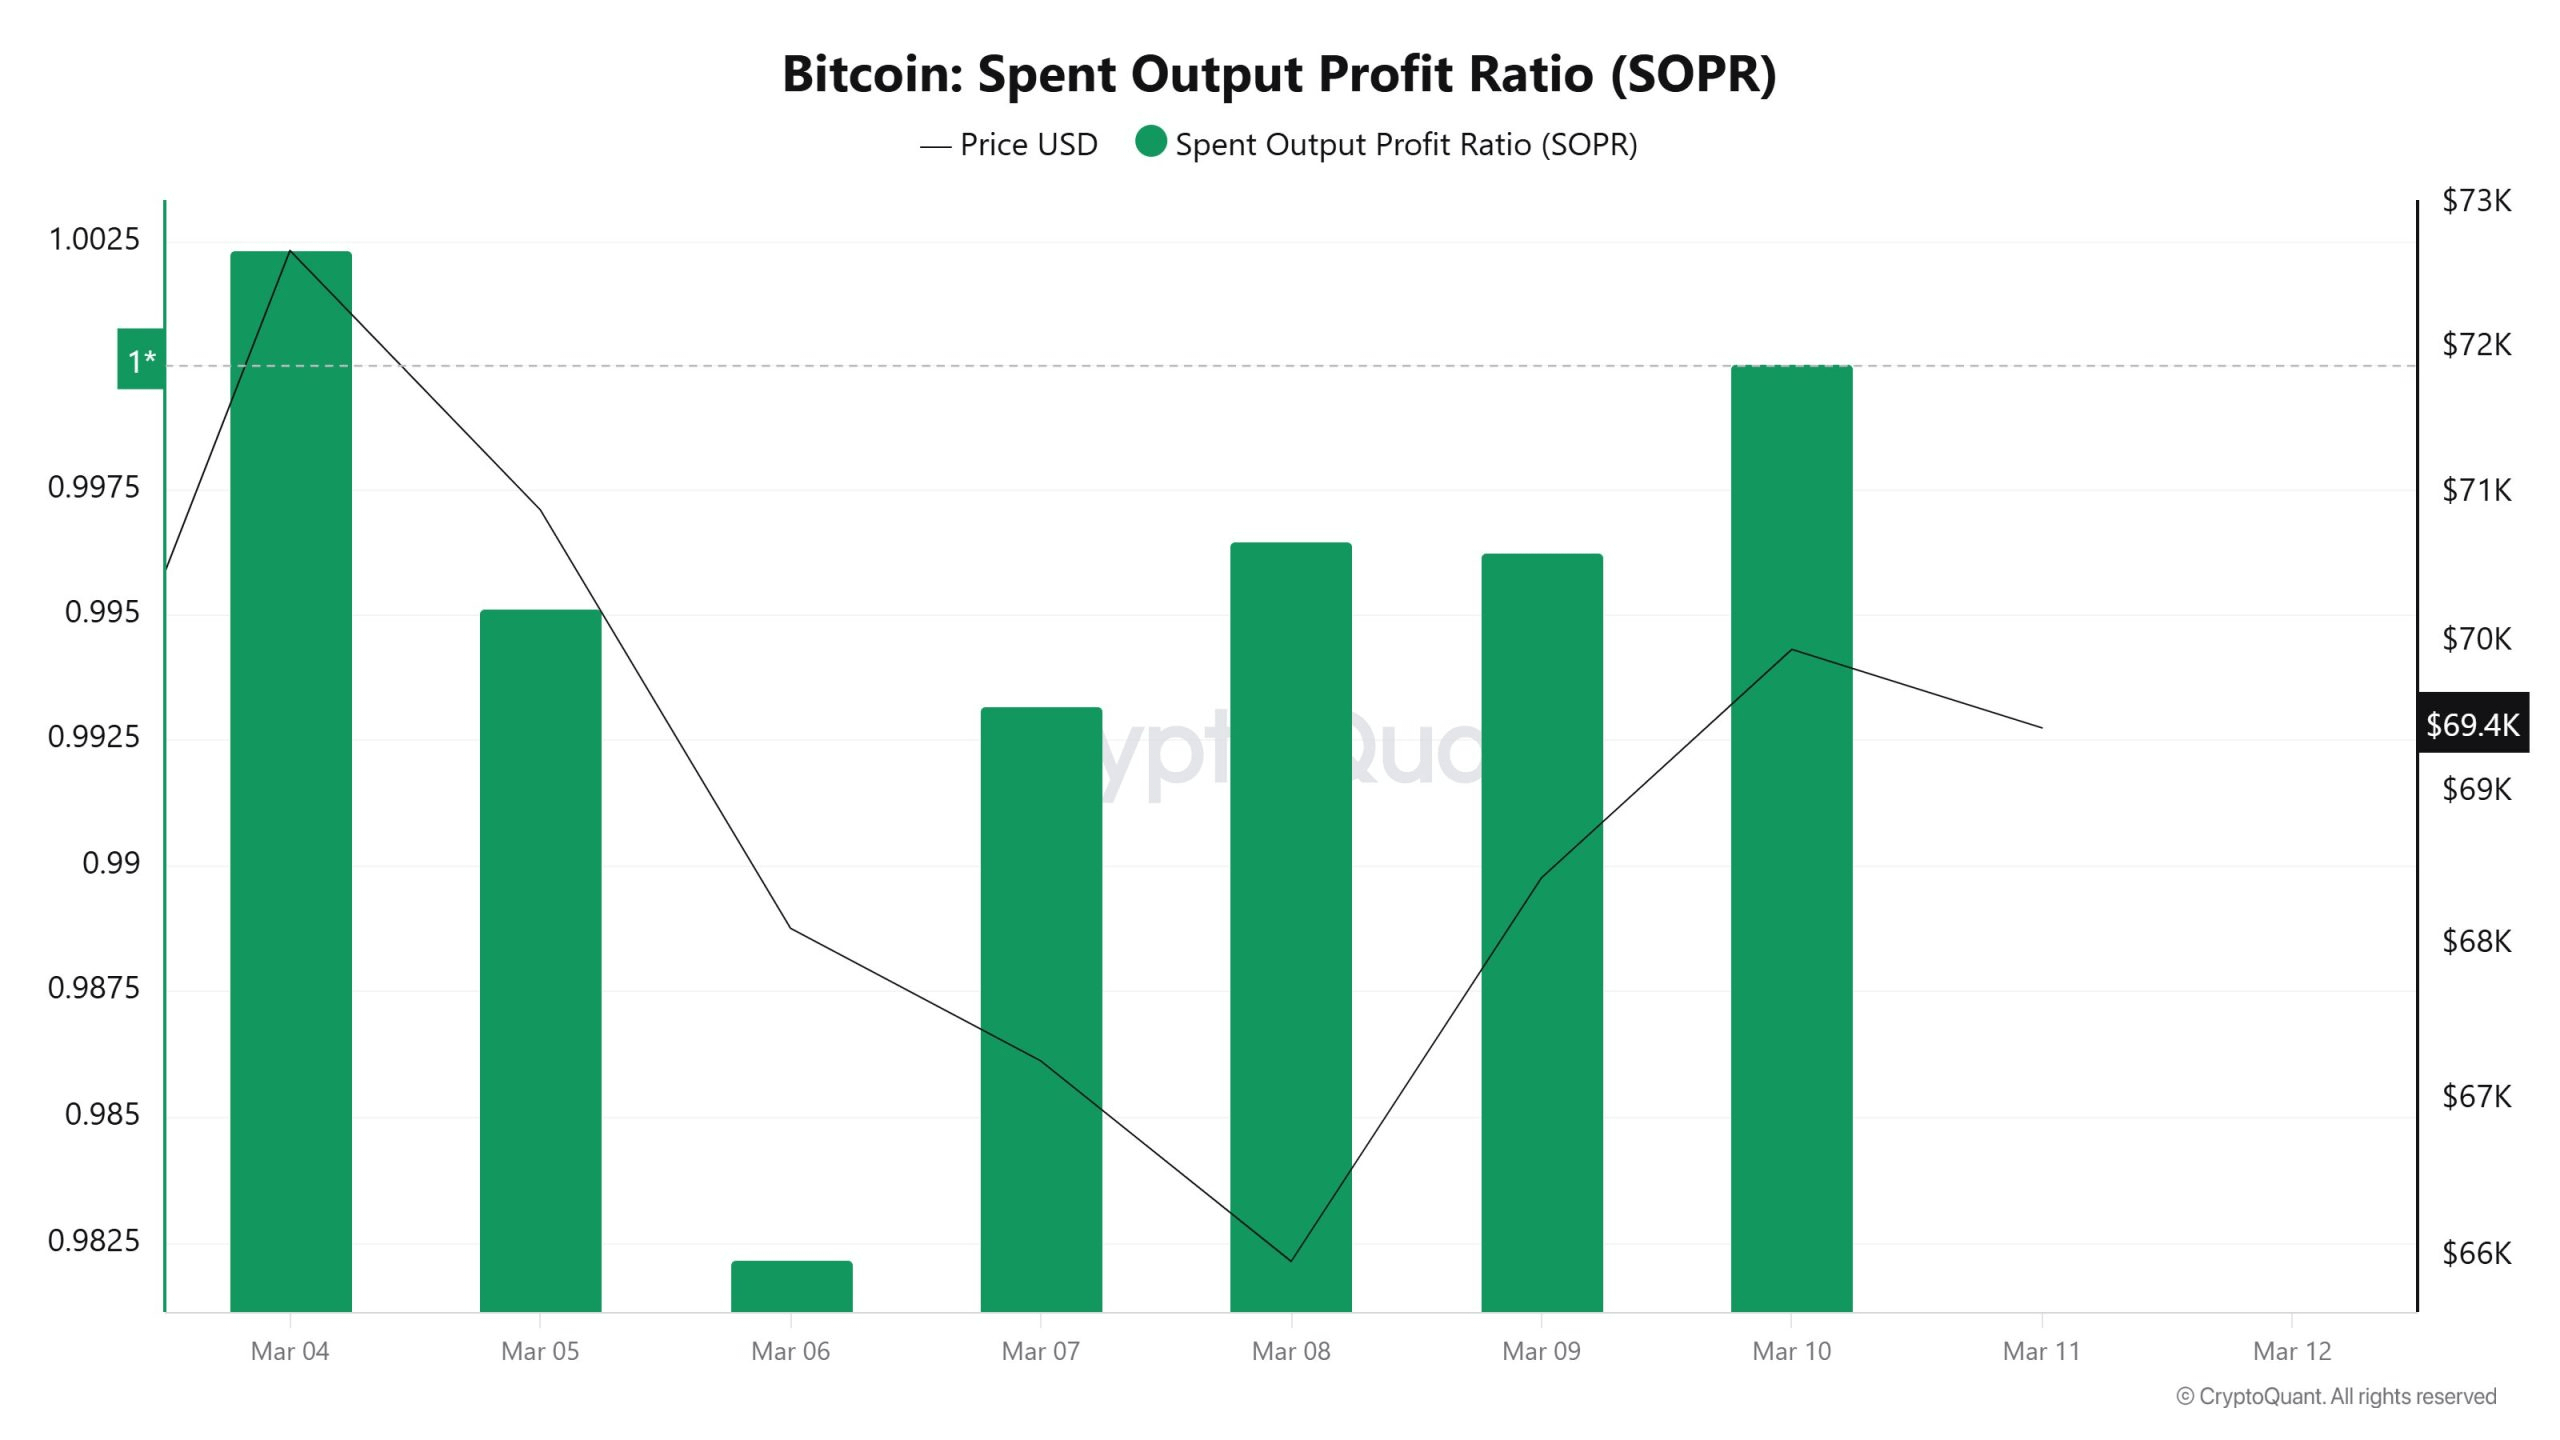
Realized Price is currently ~$54,400 → at $72k, price is still well above this, so no "true bottom" yet (some models suggest ultimate bottom around 55k).
Overall Conclusion
This is very likely just a temporary recovery (temporary relief rally / dead cat bounce) rather than the bottoming cycle fully ending.
- Reasons: On-chain remains in the “final leg of the bear market” phase (SOPR <1 + MVRV not extreme), technicals show Death Cross, and historical bear cycles often last 12–13 months (peak Oct 2025 → bottom possibly late 2026 or later).
- That said, long-term outlook is still extremely bullish thanks to ETF inflows + institutional adoption (some reports like Fidelity suggest old boom-bust cycles are evolving).
Short-term recommendations:
- Closely watch 70k (loss could lead to 60k–55k).
- If it breaks and holds 73k–75k in the coming week → probability of real reversal rises sharply.
The article above aims to provide an objective assessment of the situation and is not investment advice. Good luck and Safe Trade.
