📊
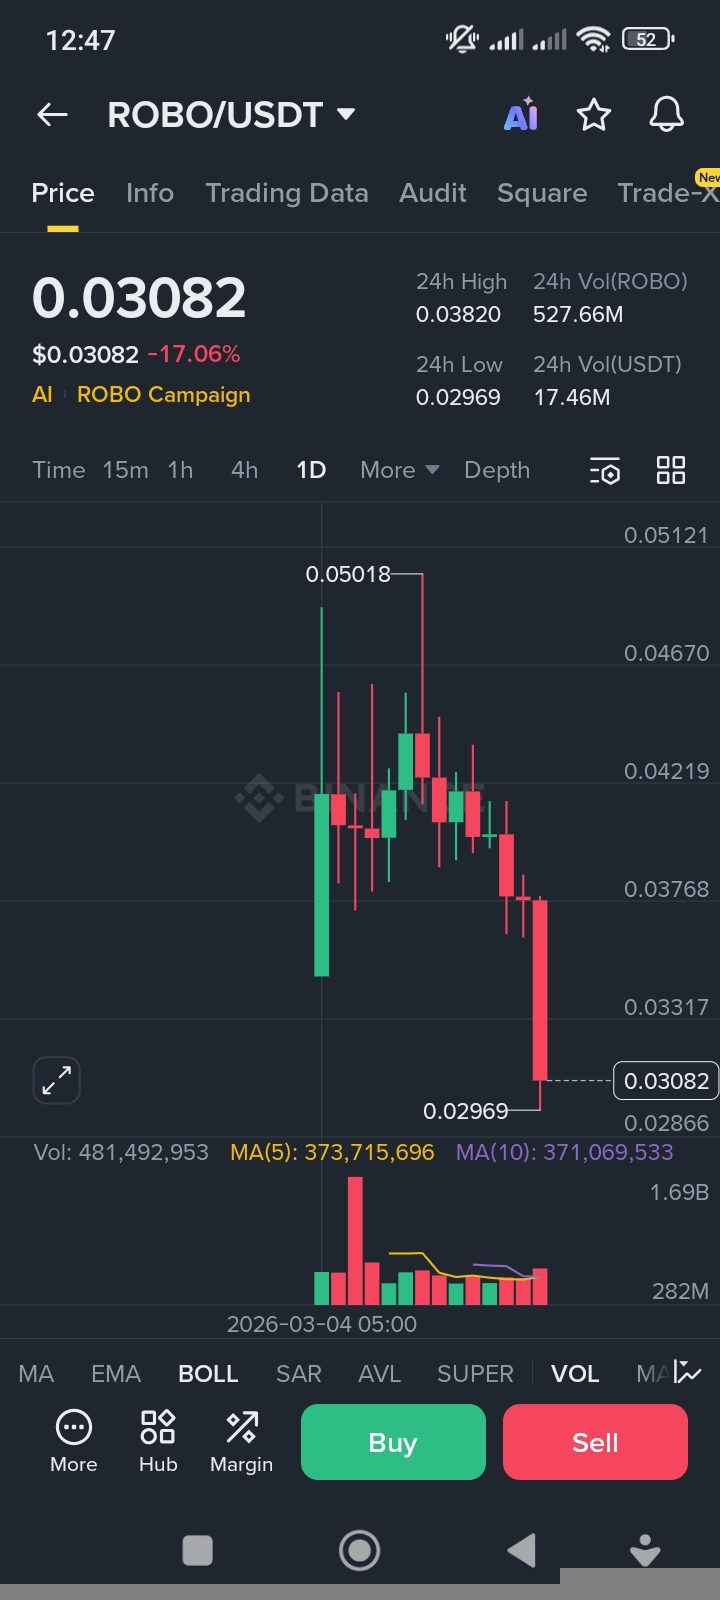
Current price: 0.03082
24h change: 🔻 ~-17%
Trend: Bearish (downtrend)
🔴 What the chart shows
1) Strong rejection from top
Price spiked to 0.05018 → very sharp wick
Indicates pump + sell-off (distribution)
Likely early buyers took profit
2) Lower highs + lower lows
Each candle closes lower than the previous peak → classic downtrend
➡️ Market structure = Bearish
3) Big red candle breakdown
The latest candle shows:
Strong selling pressure 🔻
Support break around ~0.033–0.034
High volume → panic selling or exit liquidity
4) Volume spike
Huge volume during dump = real selling, not just low liquidity
📉 Usually means trend continuation unless buyers step in
🟢 Key Support & Resistance
🟩 Support zones
0.0295 — 0.0300 → Immediate support (current area)
0.026 — 0.027 → Next major support
0.020 — 0.022 → Strong psychological support
🟥 Resistance zones
0.034 — 0.035 → First bounce target
0.038 — 0.040 → Major resistance
0.045+ → Trend reversal area
⚠️ Possible Scenarios
📉 Bearish continuation (most likely)
If 0.0295 breaks:
➡️ Price can drop toward 0.026 → 0.022
📈 Dead-cat bounce
Short-term rebound possible because:
Price fell fast
Traders may buy dip
Bounce target: 0.033 — 0.035
🚀 Bullish reversal (needs confirmation)
Only if price:
✔️ Reclaims 0.038+
✔️ Forms higher highs
✔️ Volume shifts to buyers
🧠 My Trading View
👉 Currently risky to long without confirmation
👉 Looks like post-pump correction phase
👉 Wait for stabilization before entry
🛑 If you are holding
Short term: expect volatility
Consider risk management
Watch support at 0.0295
✅ Buy zone for safe entry
✅ Short-term target prices
✅ Long-term potential
✅ Whether this looks like a pump-and-dump coin
✅ Strategy for futures trading
Just ask 📈