
1) Executive summary
Aave $AAVE is DeFi's dominant lending project, operating decentralized markets where users supply assets to earn yield and borrowers access overcollateralized loans. The project manages risk parameters directly through governance, offering a battle-tested approach to decentralized lending with over five years of operational history.
Since launching in 2020, Aave has iterated toward greater capital efficiency, risk segmentation, and multichain expansion across three major versions. V4, a modular redesign introducing a hub-and-spoke architecture, launched on Ethereum in late March 2026 with conservative supply and borrow caps, allowing the project to scale in a controlled manner alongside the existing V3 deployment.
March represented a normalization following February's correction-driven volatility. TVL and active loans continued to decline but at a notably more moderate pace, and both metrics remain well above year-ago levels. Fees and revenue fell more sharply in headline terms, though this was driven primarily by the absence of February's one-off liquidation and SVR income rather than deterioration in the underlying interest-generating business. GHO market cap grew for a third consecutive month, crossing $500m for the first time.
The project ended March with over $42b in deposits across 14 chain deployments, with Ethereum accounting for over 80% of capital. Market share stabilized at approximately 60% of all DeFi lending activity, with Aave holding more active loans than all other tracked competitors combined.
🔑 Key metrics (March 2026)
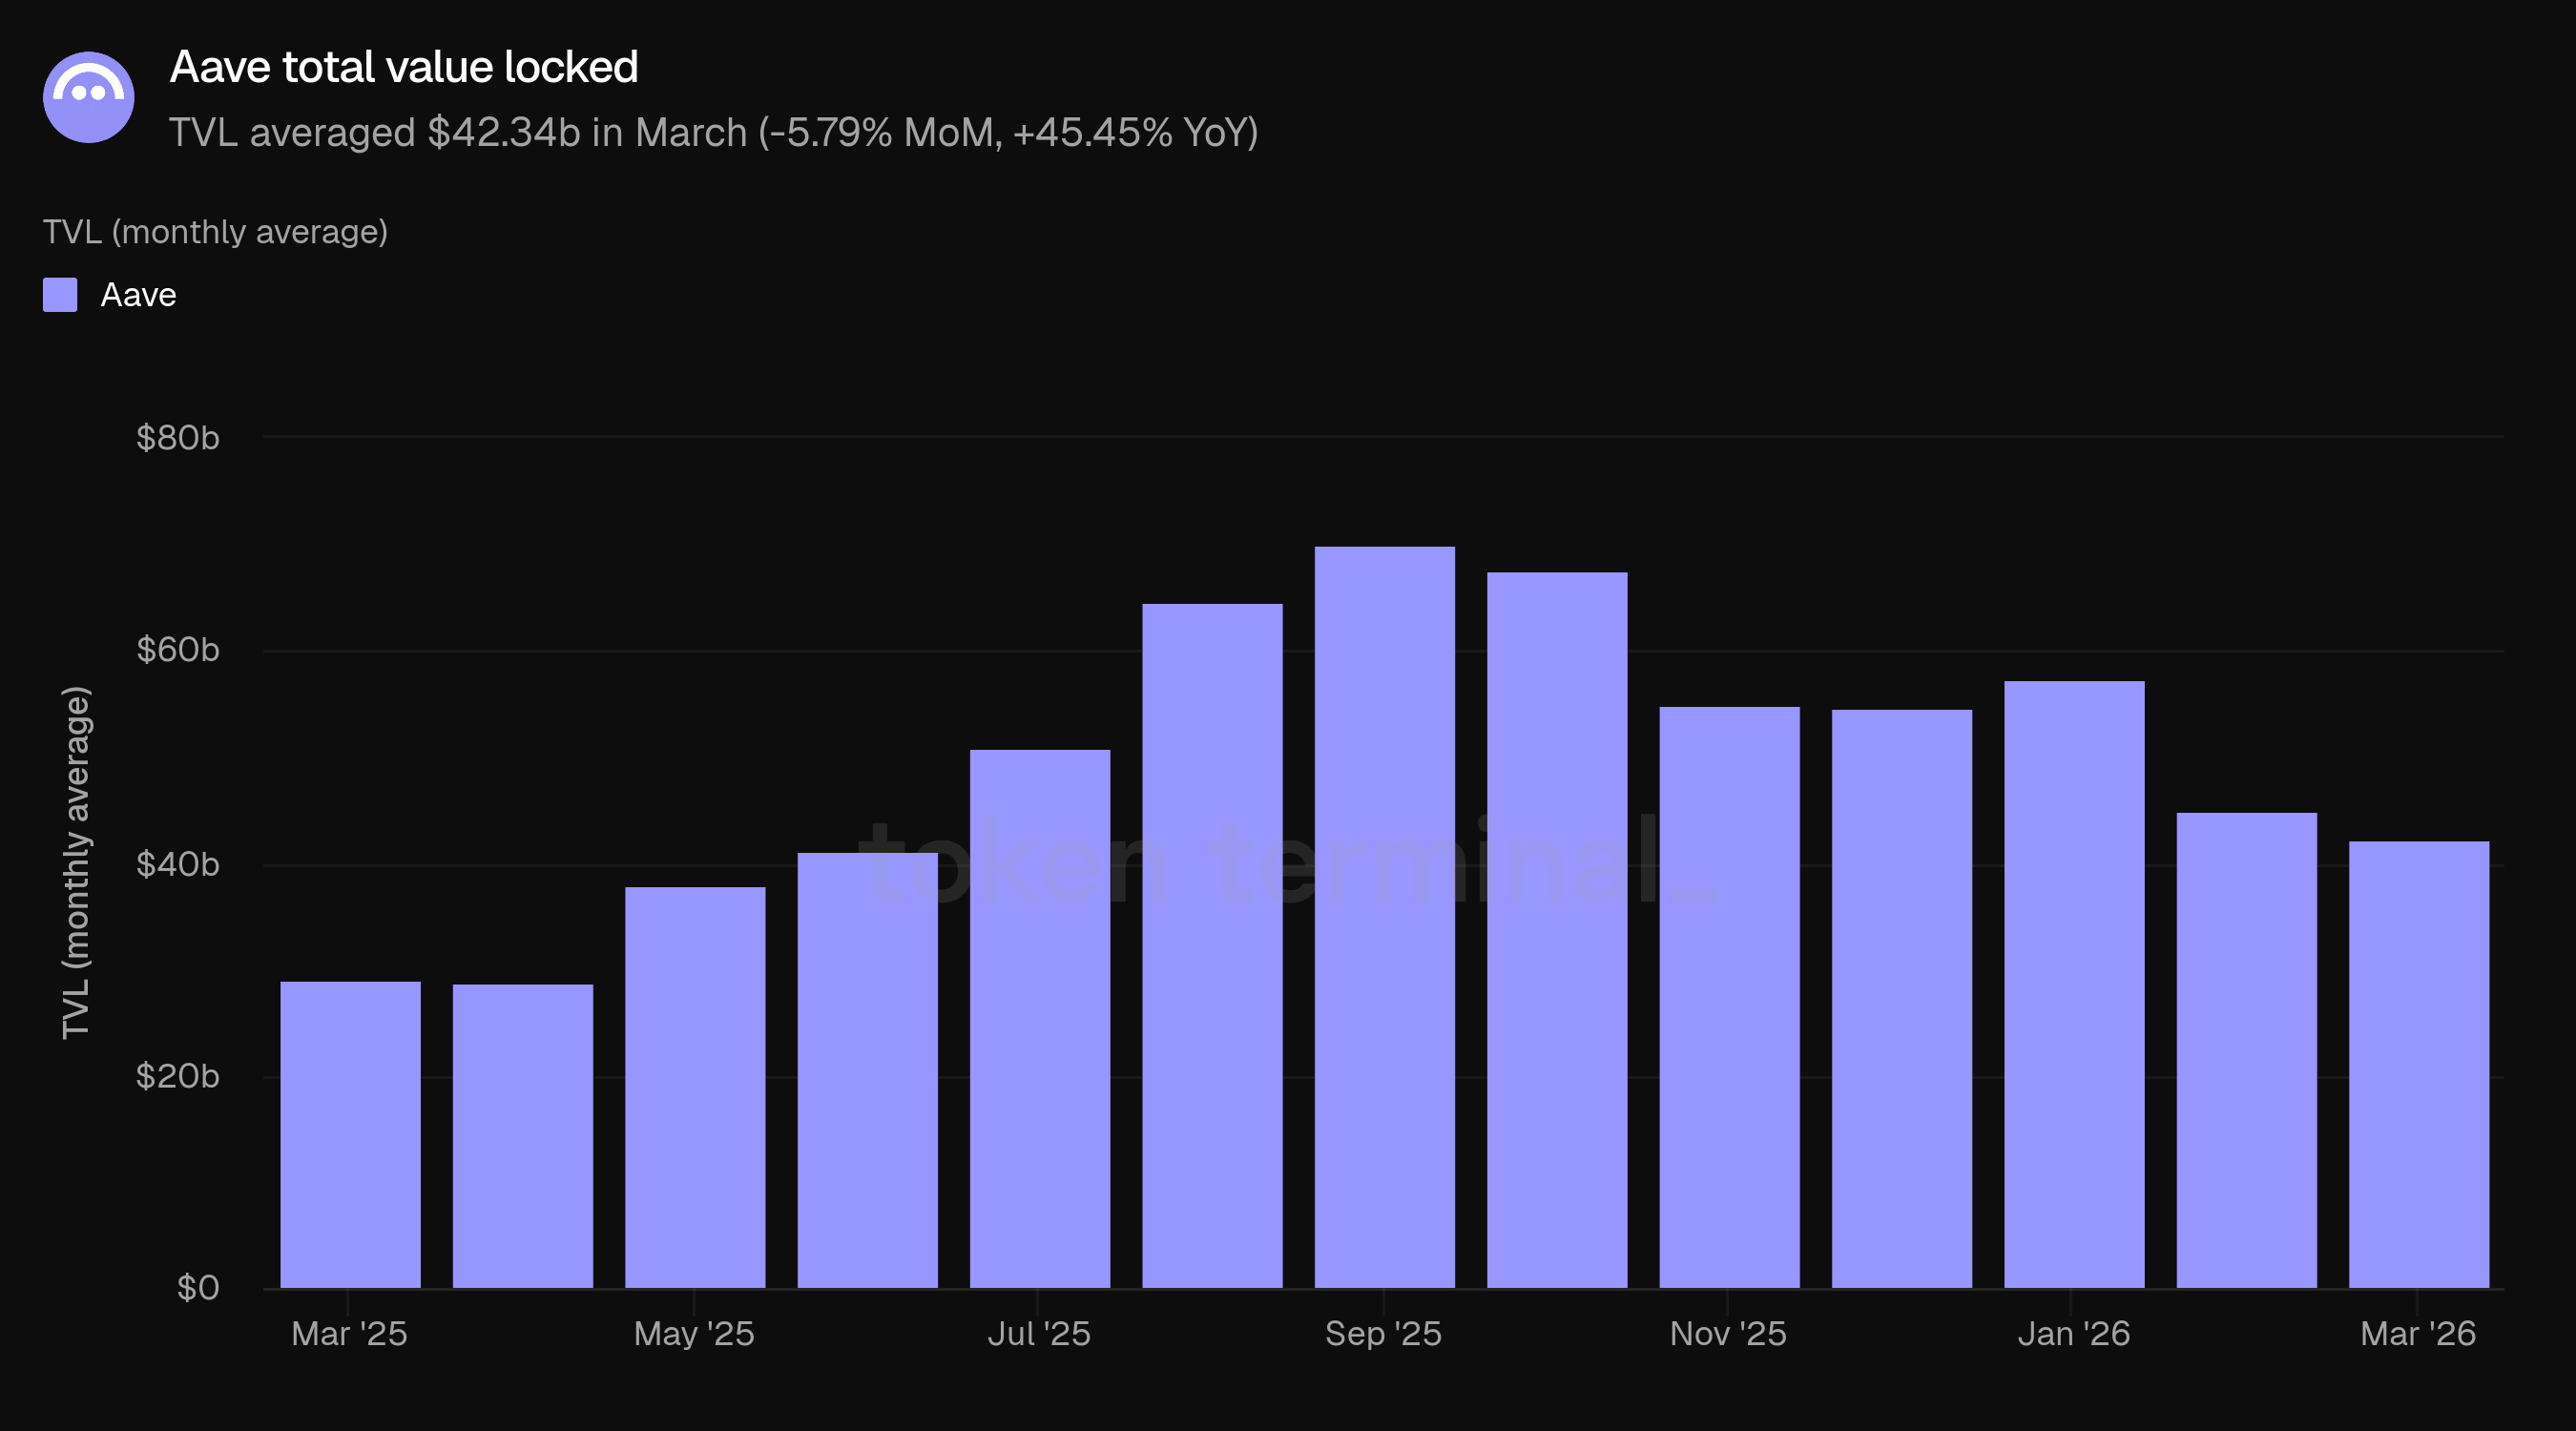
Total value locked: $42.34b (-5.79% MoM, +45.45% YoY)
Active loans: $16.55b (-6.96% MoM, +47.32% YoY)
Fees: $43.94m (-40.57% MoM, +9.01% YoY)
Revenue: $6.64m (-50.45% MoM, +7.79% YoY)
Monthly active users: 114.4k (-26.03% MoM, +2.10% YoY)
Market share: 59.79% (-2.95 pp MoM, +0.63 pp YoY)
Metrics exclude Aave deployments not yet tracked by Token Terminal, including Mantle and MegaETH.
📌 Highlights (March 2026)
Aave V4 and Aave Pro launched on Ethereum
Whop Treasury went live
"Aave Will Win" ARFC published
First quarterly livestream held
👥 Aave Labs team commentary
"March was defined by the launch of Aave V4 and Aave Pro on Ethereum. V4 introduces a modular architecture where borrowing strategies ('spokes') plug into shared liquidity pools ('hubs'), making it possible to extend Aave into new asset classes without fragmenting liquidity. The initial configuration includes three hubs: Prime for conservative collateral-only strategies, Core for standard lending, and Plus for advanced leveraged positions. Aave Pro, V4's flagship interface, is now live and built for sophisticated DeFi users with full control over collateral swaps, debt management, and leveraged strategies. V3 remains fully operational with no forced migration.
Aave is building toward two distinct markets simultaneously. On the retail side, the Aave App is designed as a consumer savings product that competes directly with traditional fintech offerings: fixed-rate savings accounts, instant bank transfers, biometric recovery, and a user experience where the underlying blockchain infrastructure is invisible. There are roughly 40 million DeFi users today and over 4 billion fintech users. Aave App targets the latter. On the institutional side, Aave Horizon provides permissioned lending markets for tokenized real-world assets, positioning Aave as an onchain repo market for asset managers, funds, and issuers who need 24/7 liquidity against regulated collateral. V4's modular architecture is what connects these two markets: the same liquidity hubs serve both consumer and institutional borrowing strategies.
Distribution accelerated through fintech integrations in March. The Whop Treasury integration brought Aave-powered yield to a commerce platform with over 21 million users, most of whom have never interacted with DeFi directly. Privy Earn and Kraken's DeFi Earn expanded access through wallet infrastructure and exchange channels. Aave crossed $1 trillion in cumulative loan volume during Q1, and processed over $500 million in liquidations in a single week during February's downturn without protocol-level disruption. GHO supply hit a new all-time high in March. The Mantle/Bybit deployment reached $1.25 billion in deposits within 18 days of launch, though this is not yet reflected in Token Terminal data.
The 'Aave Will Win' ARFC, published March 27, proposes directing all application-layer revenue from Aave Pro, Aave App, and Aave Kit to the DAO, formalizing a model where every revenue-generating product flows back to AAVE holders. The V4 roadmap for the remainder of 2026 includes additional borrowing strategies, with a focus on institutional use cases, as outlined during the Q1 2026 livestream. The full Aave App release (iOS and Android) is expected in Q2, with Euro savings accounts and the Aave Earn Card following in H2. Aave Horizon is planned to migrate to V4 infrastructure in Q4."
2) Total value locked
Total value locked (TVL) measures the total USD value of collateral deposited into Aave and outstanding loans. March TVL averaged $42.34b, down 5.79% from February's $44.94b but up 45.45% from March 2025's $29.11b.
The pace of decline moderated significantly compared to February, which saw a 21.58% drop driven by the early-month market correction. March's 5.79% decline reflects the continued effect of lower asset prices rather than a fresh wave of outflows. The month saw relatively stable day-to-day TVL, in contrast to February's sharp intra-month drawdowns.
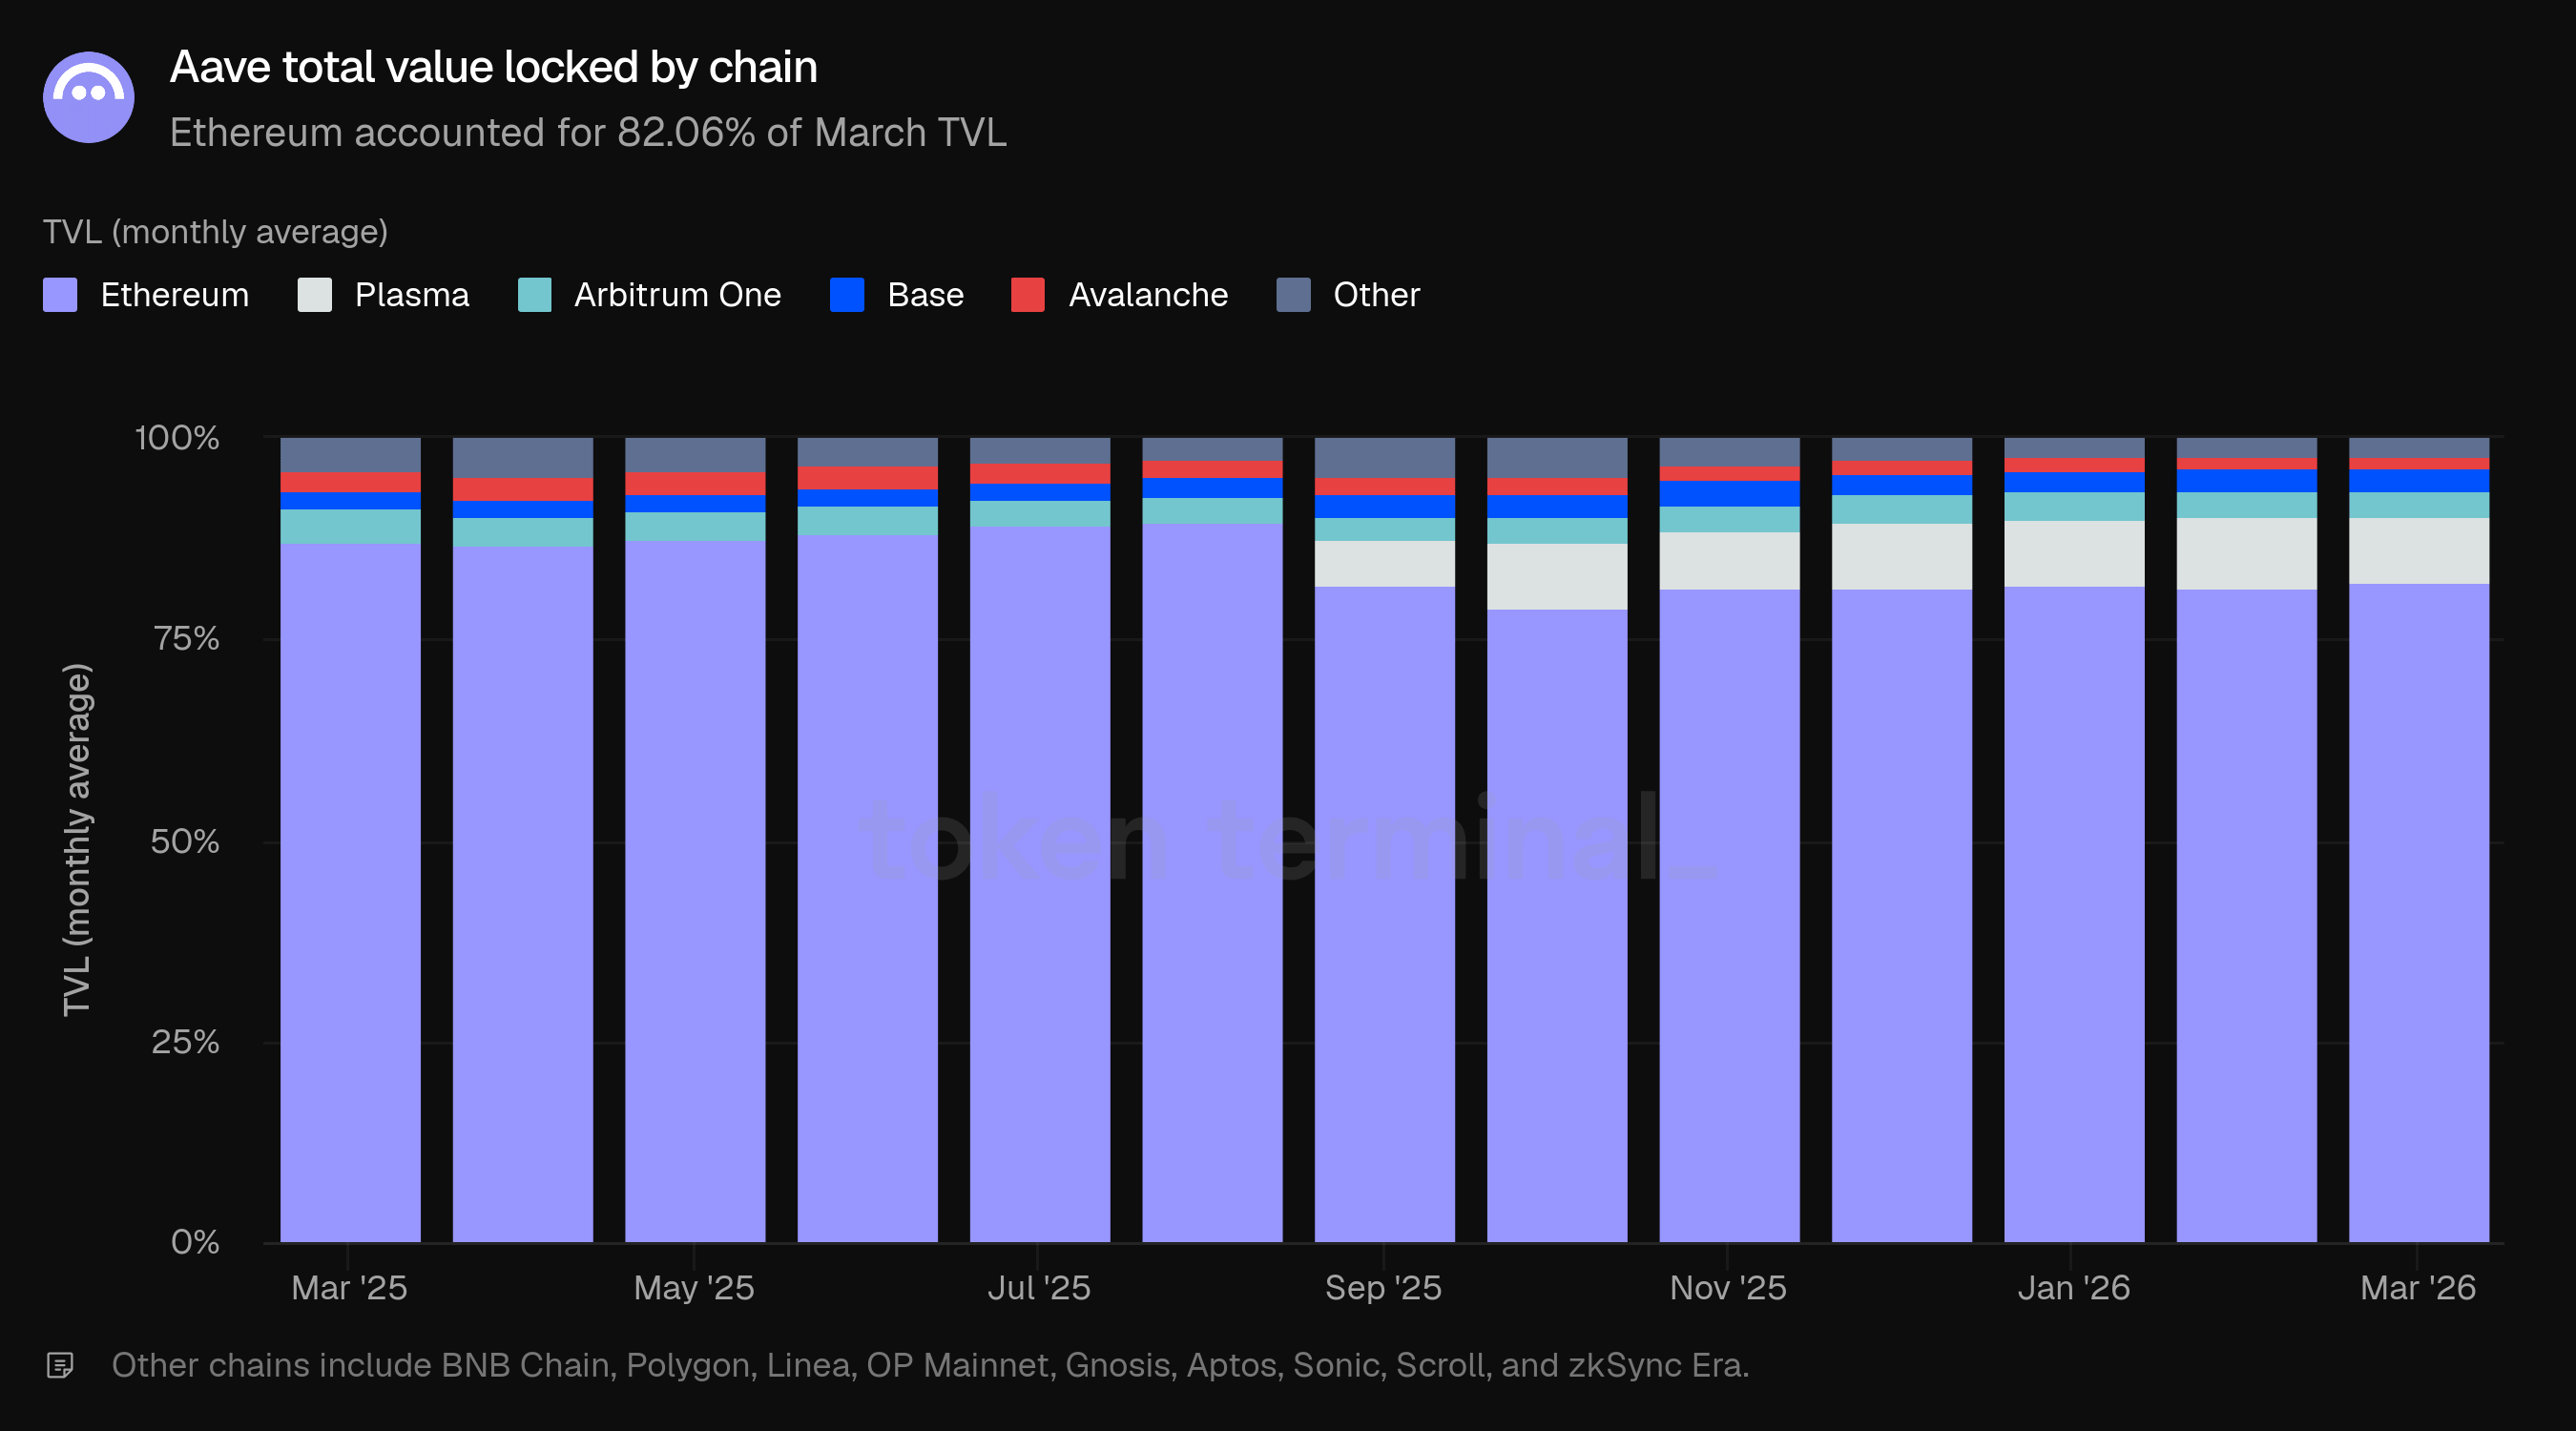
Ethereum accounted for 82.06% of March TVL, up slightly from 81.48% in February. Plasma held the second-largest share at 8.45%, down from 9.05%, followed by Arbitrum One at 2.99%, Base at 2.94%, Avalanche at 1.54%, and other chains at 2.01%.
Compared to March 2025, the chain distribution has diversified. Ethereum's share has declined from 87.30% to 82.06%, with Plasma, Base, and other deployments absorbing the difference. This reflects Aave's multichain strategy, though Ethereum remains the overwhelming center of gravity for capital.
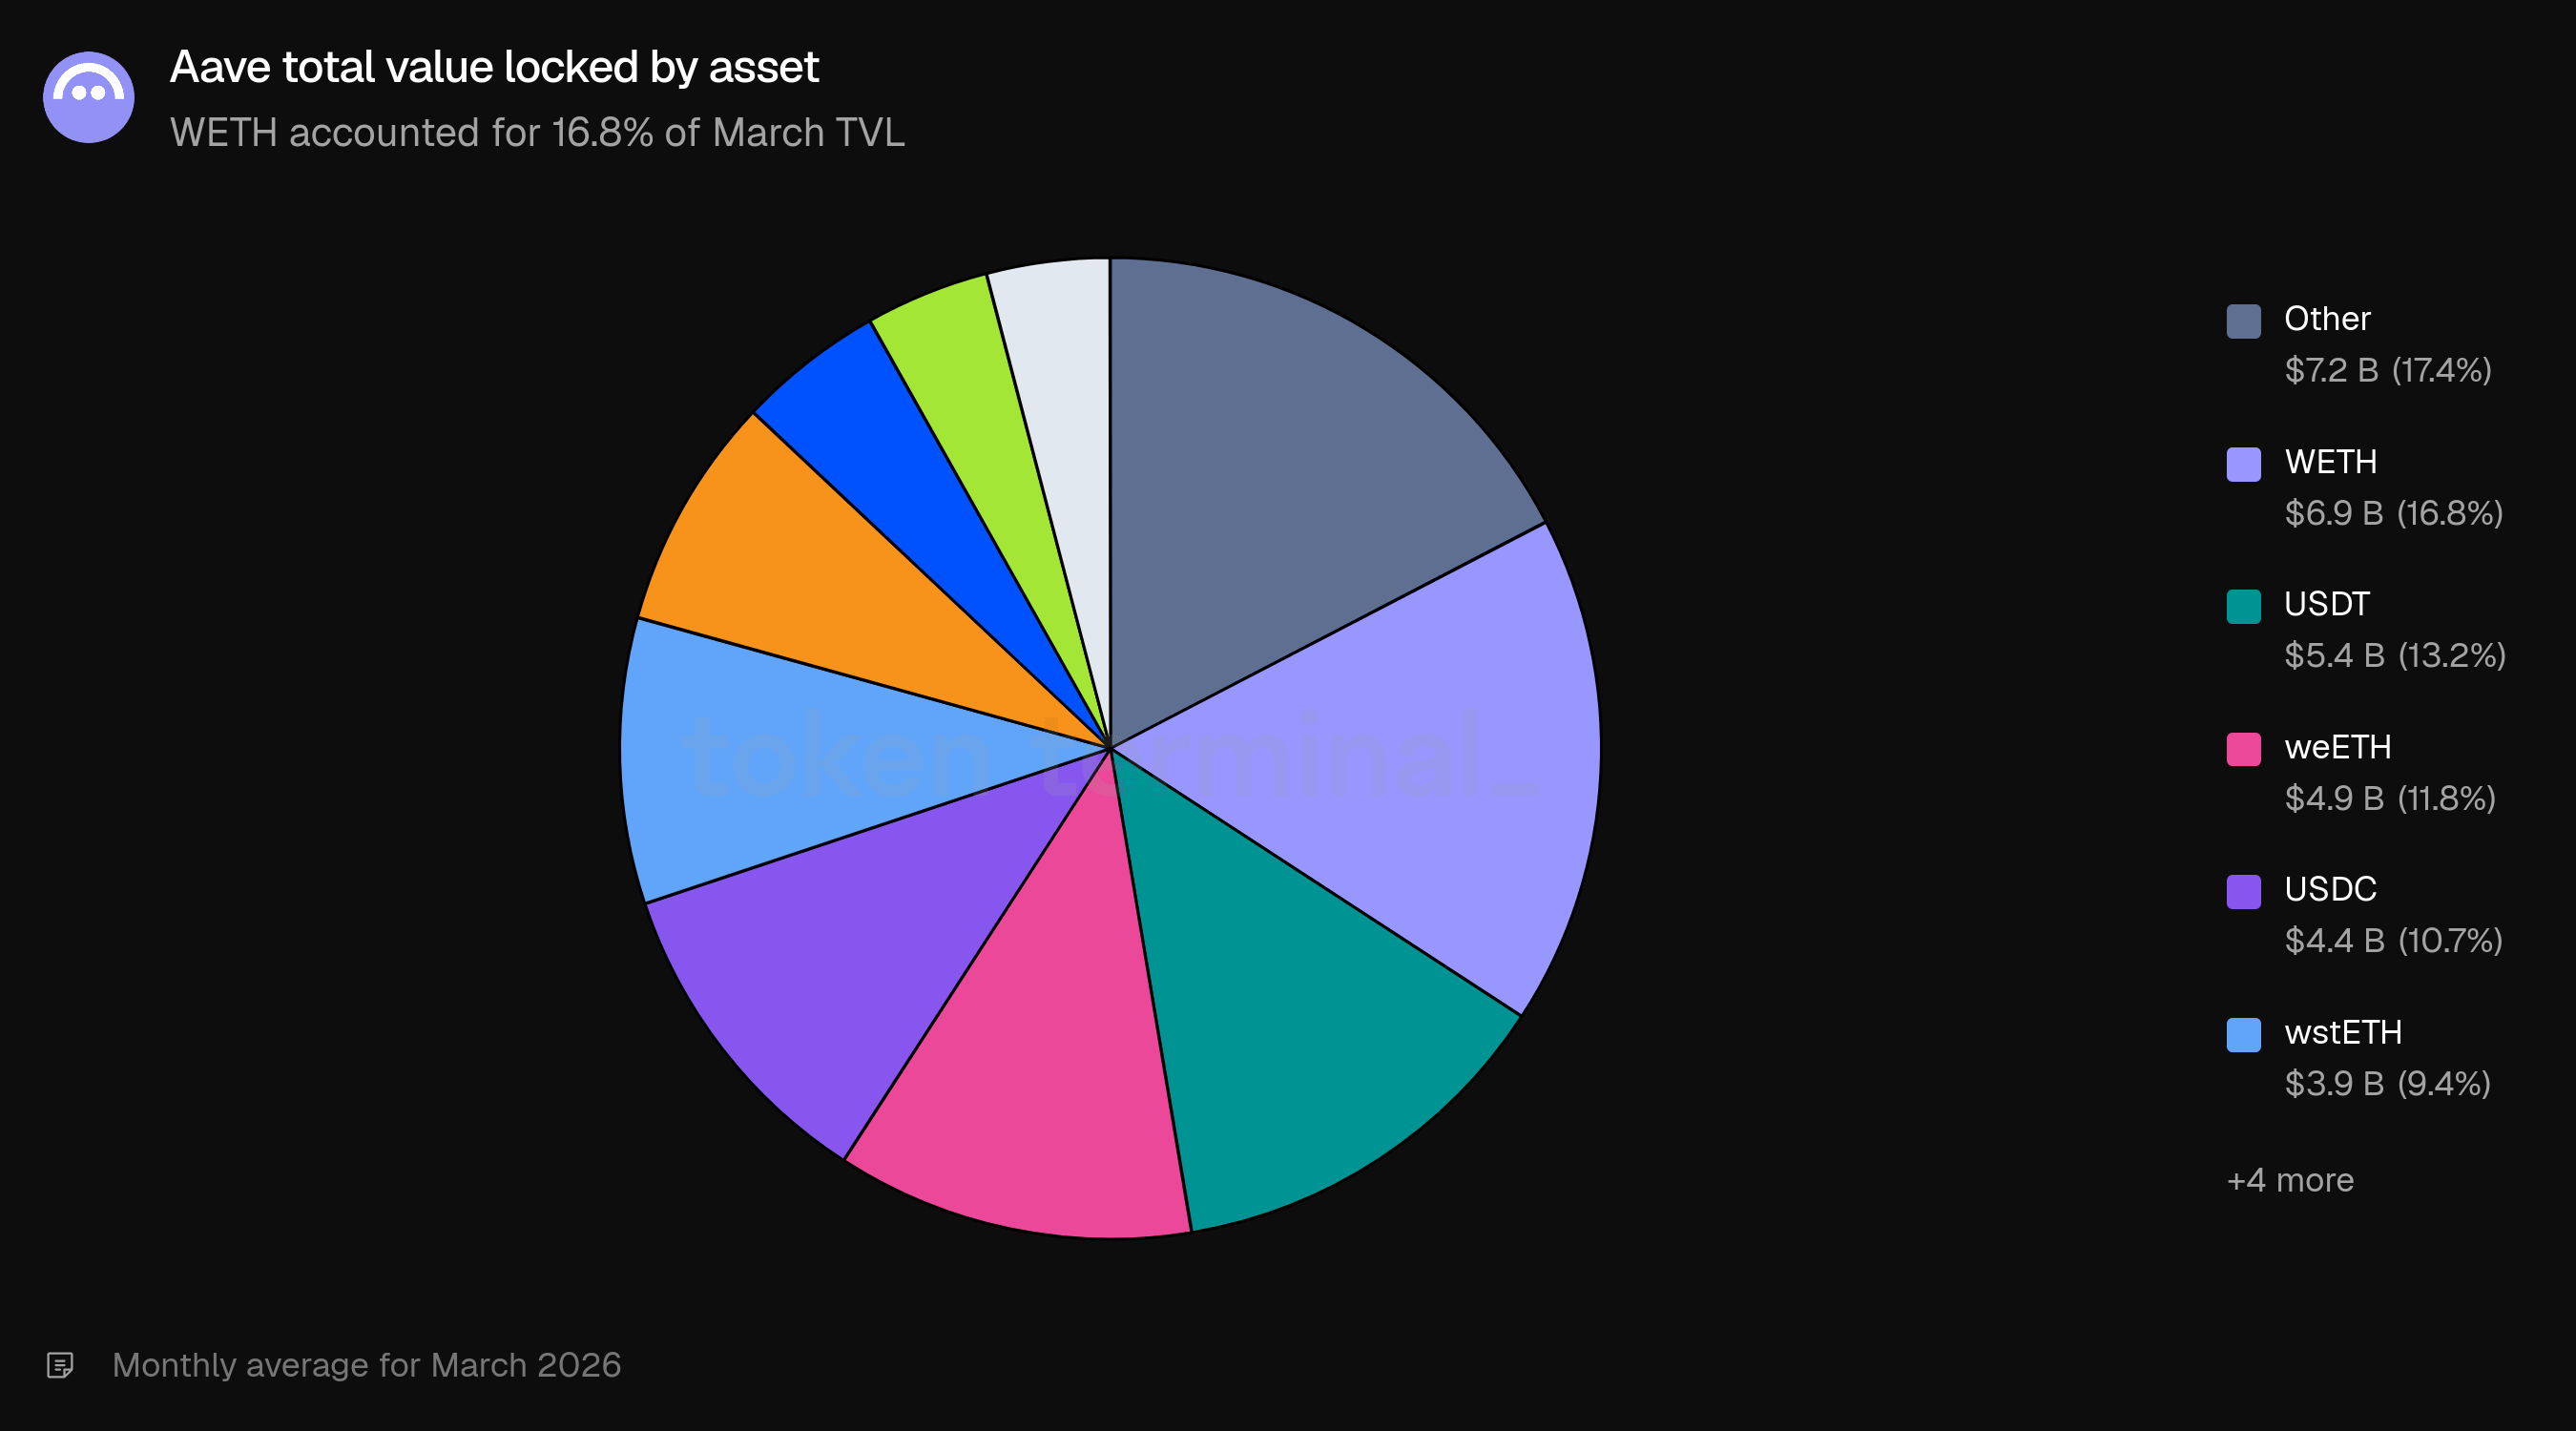
The asset composition was diversified, with WETH leading at 16.8%, followed by USDT (13.2%), weETH (11.8%), USDC (10.7%), and wstETH. Wrapped BTC variants (WBTC and cbBTC) combined for approximately 12.0%. Stablecoins including USDT, USDC, USDT0, and USDe collectively accounted for over 33% of TVL, reflecting Aave's dual role as both a leveraged exposure venue and a stablecoin yield market.
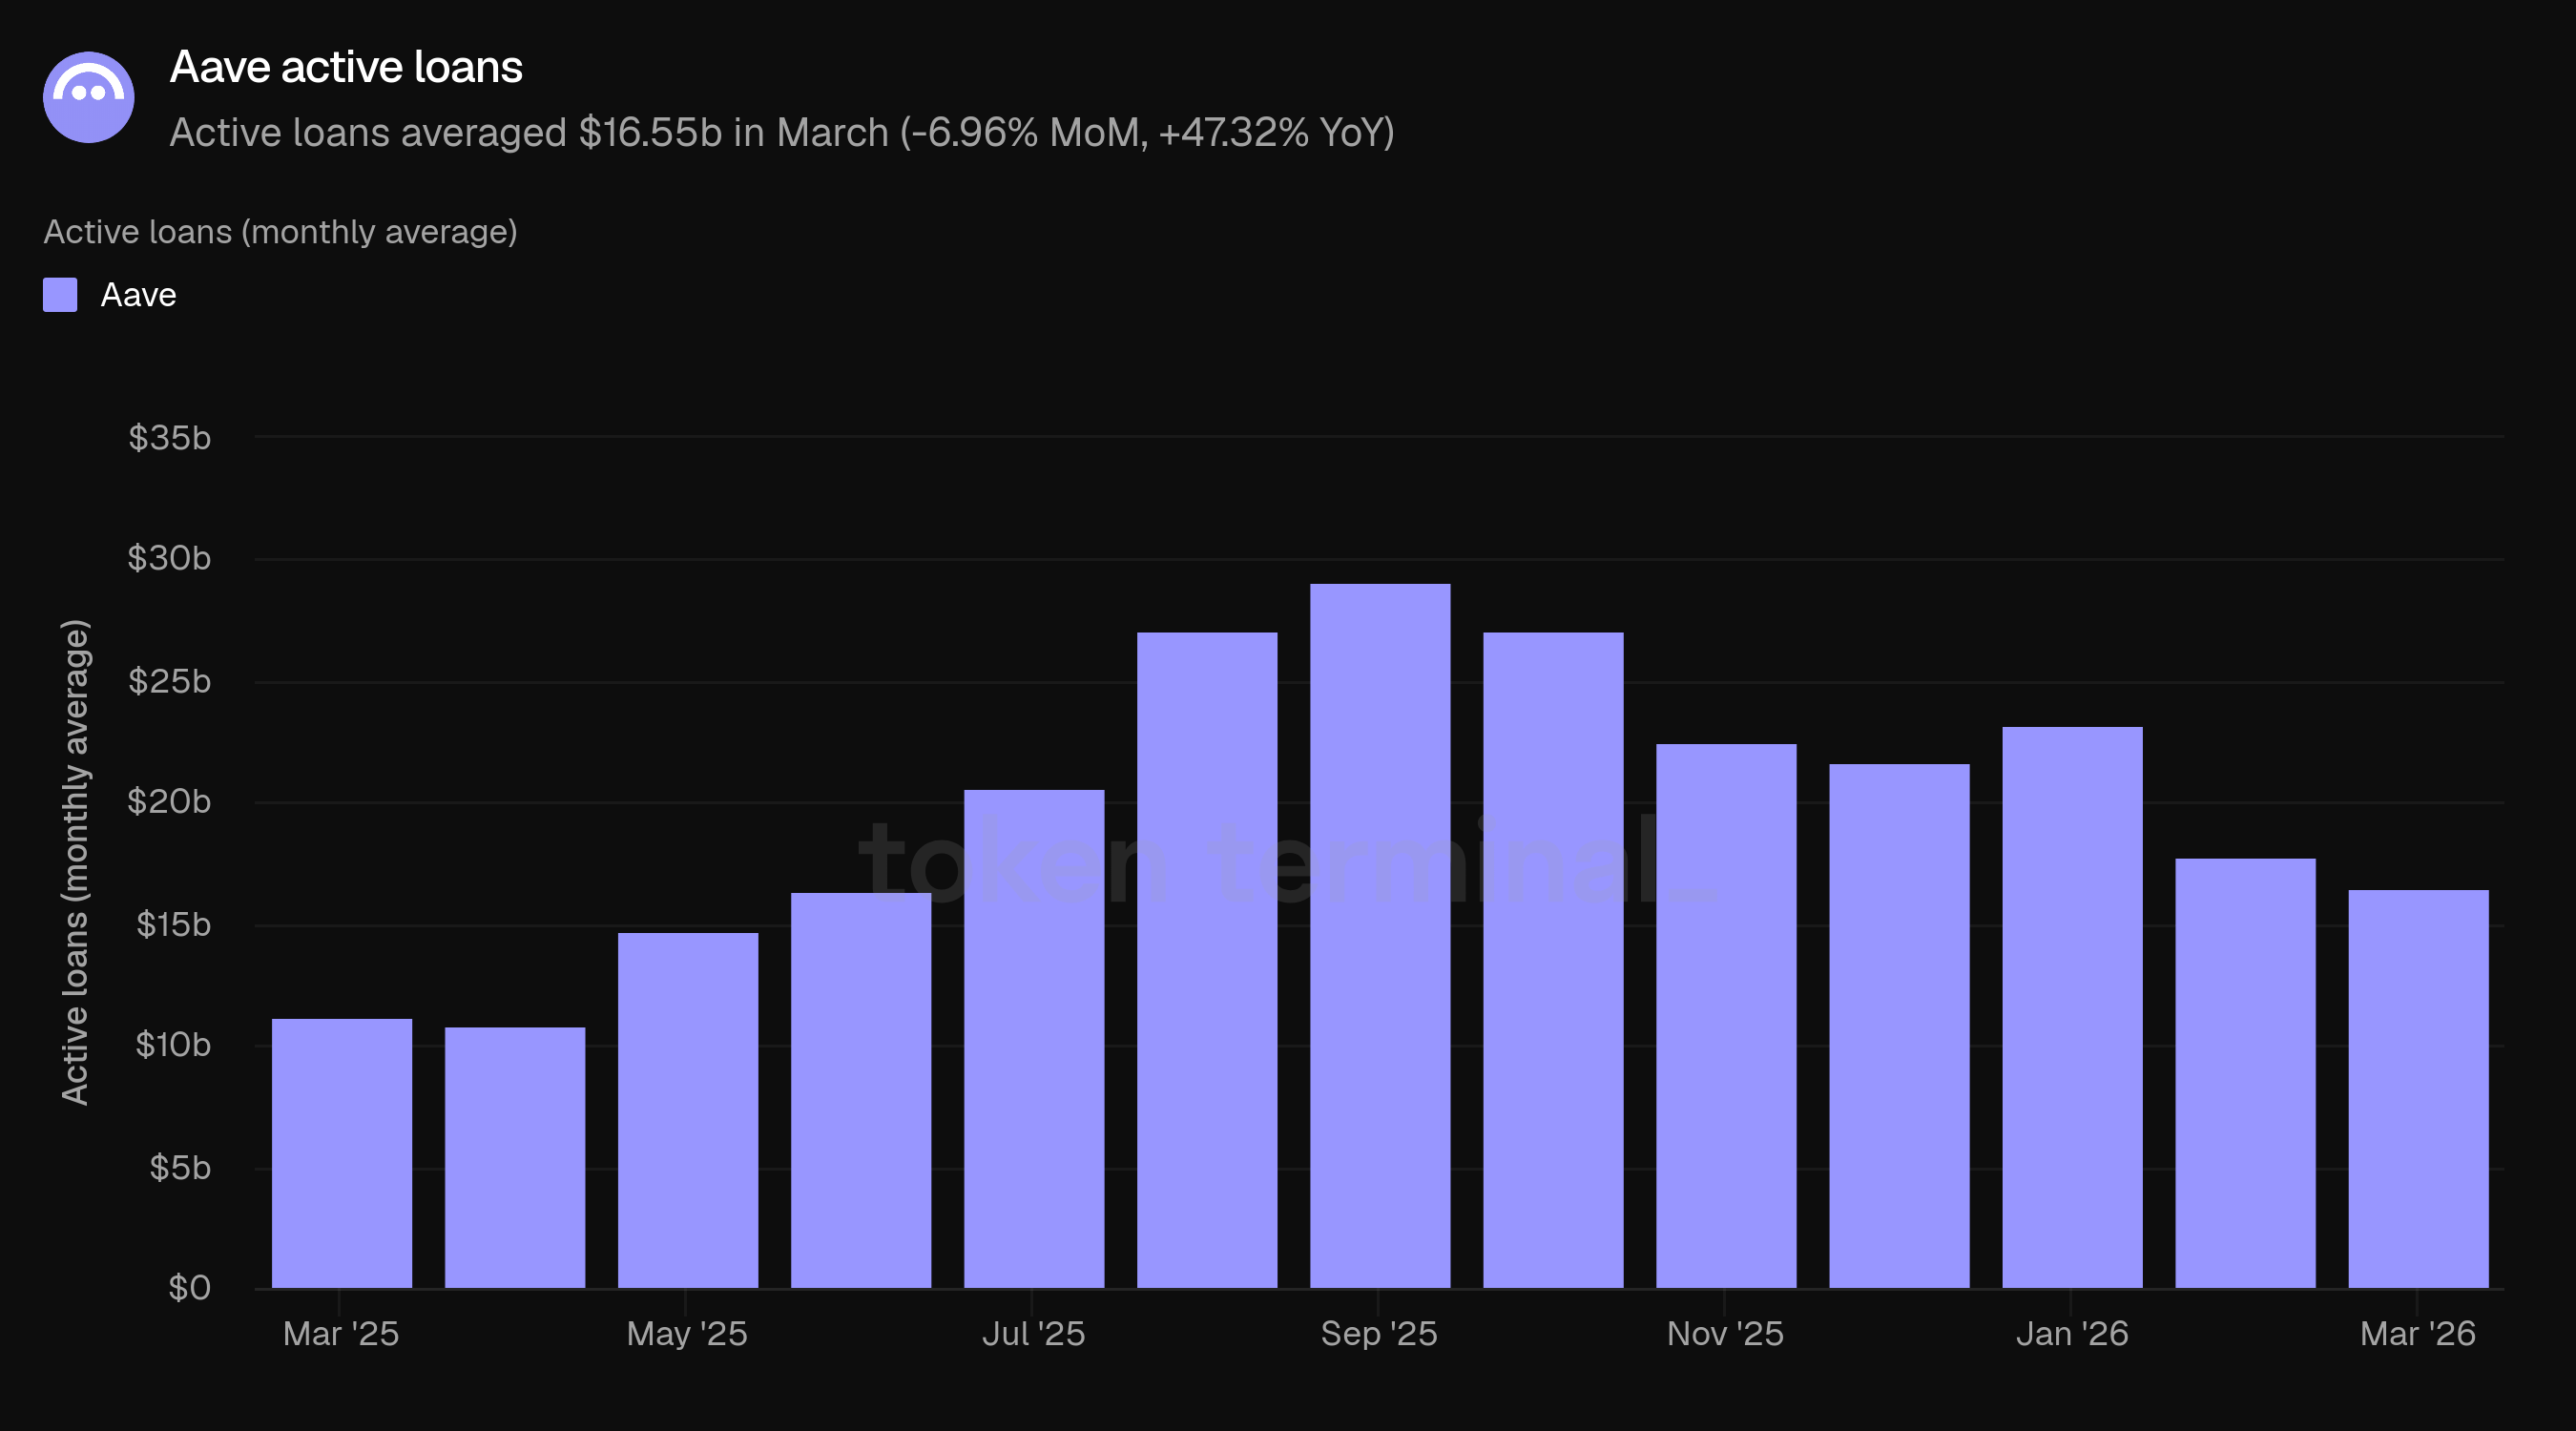
3) Active loans
Active loans measures the total USD value of outstanding borrows across all Aave lending markets. March active loans averaged $16.55b, down 6.96% from February's $17.79b but up 47.32% from March 2025's $11.24b.
The active loans decline slightly exceeded the TVL decline (-6.96% vs. -5.79%). The utilization rate (active loans as a share of TVL) was approximately 39.1% in March, compared to 39.6% in February, a marginal shift that indicates the lending market remained active despite lower absolute balances.
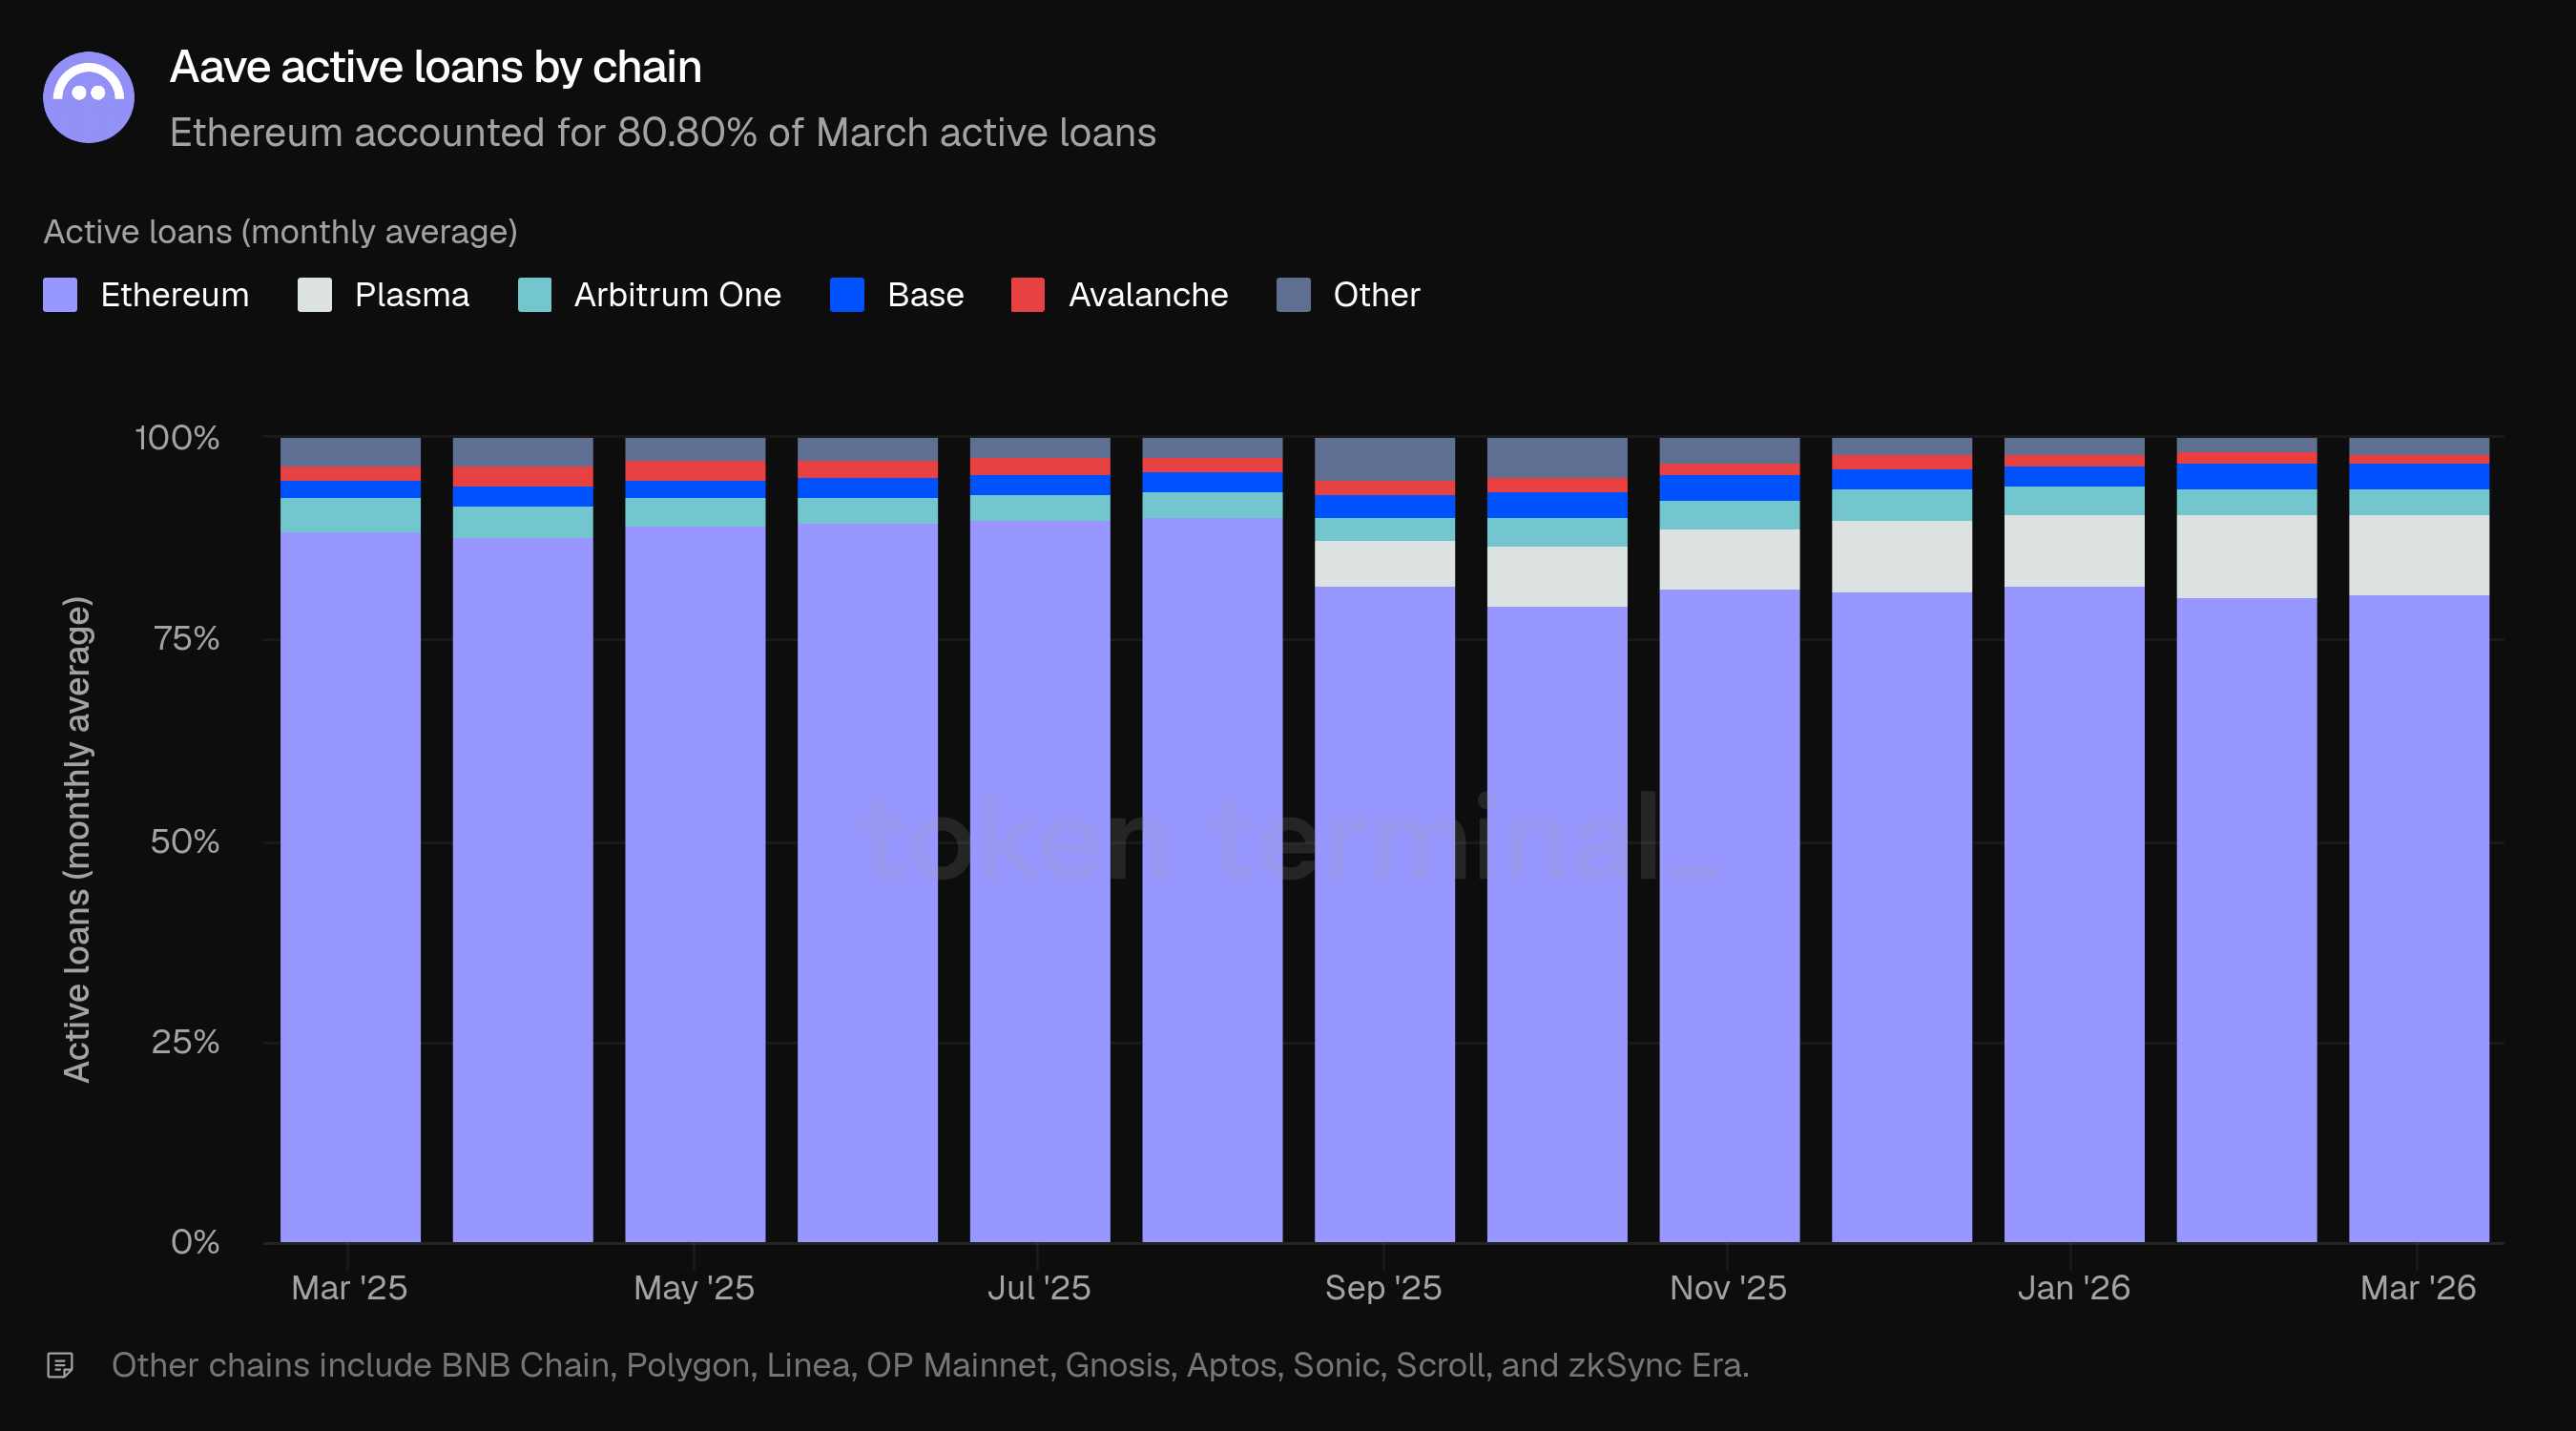
The chain distribution closely mirrored TVL. Ethereum accounted for 80.80% of March active loans, with Plasma at 9.98%, Base at 3.12%, Arbitrum One at 3.11%, Avalanche at 1.38%, and other chains at 1.62%. Plasma's active loan share declined slightly from 10.28% in February, while Ethereum held steady.
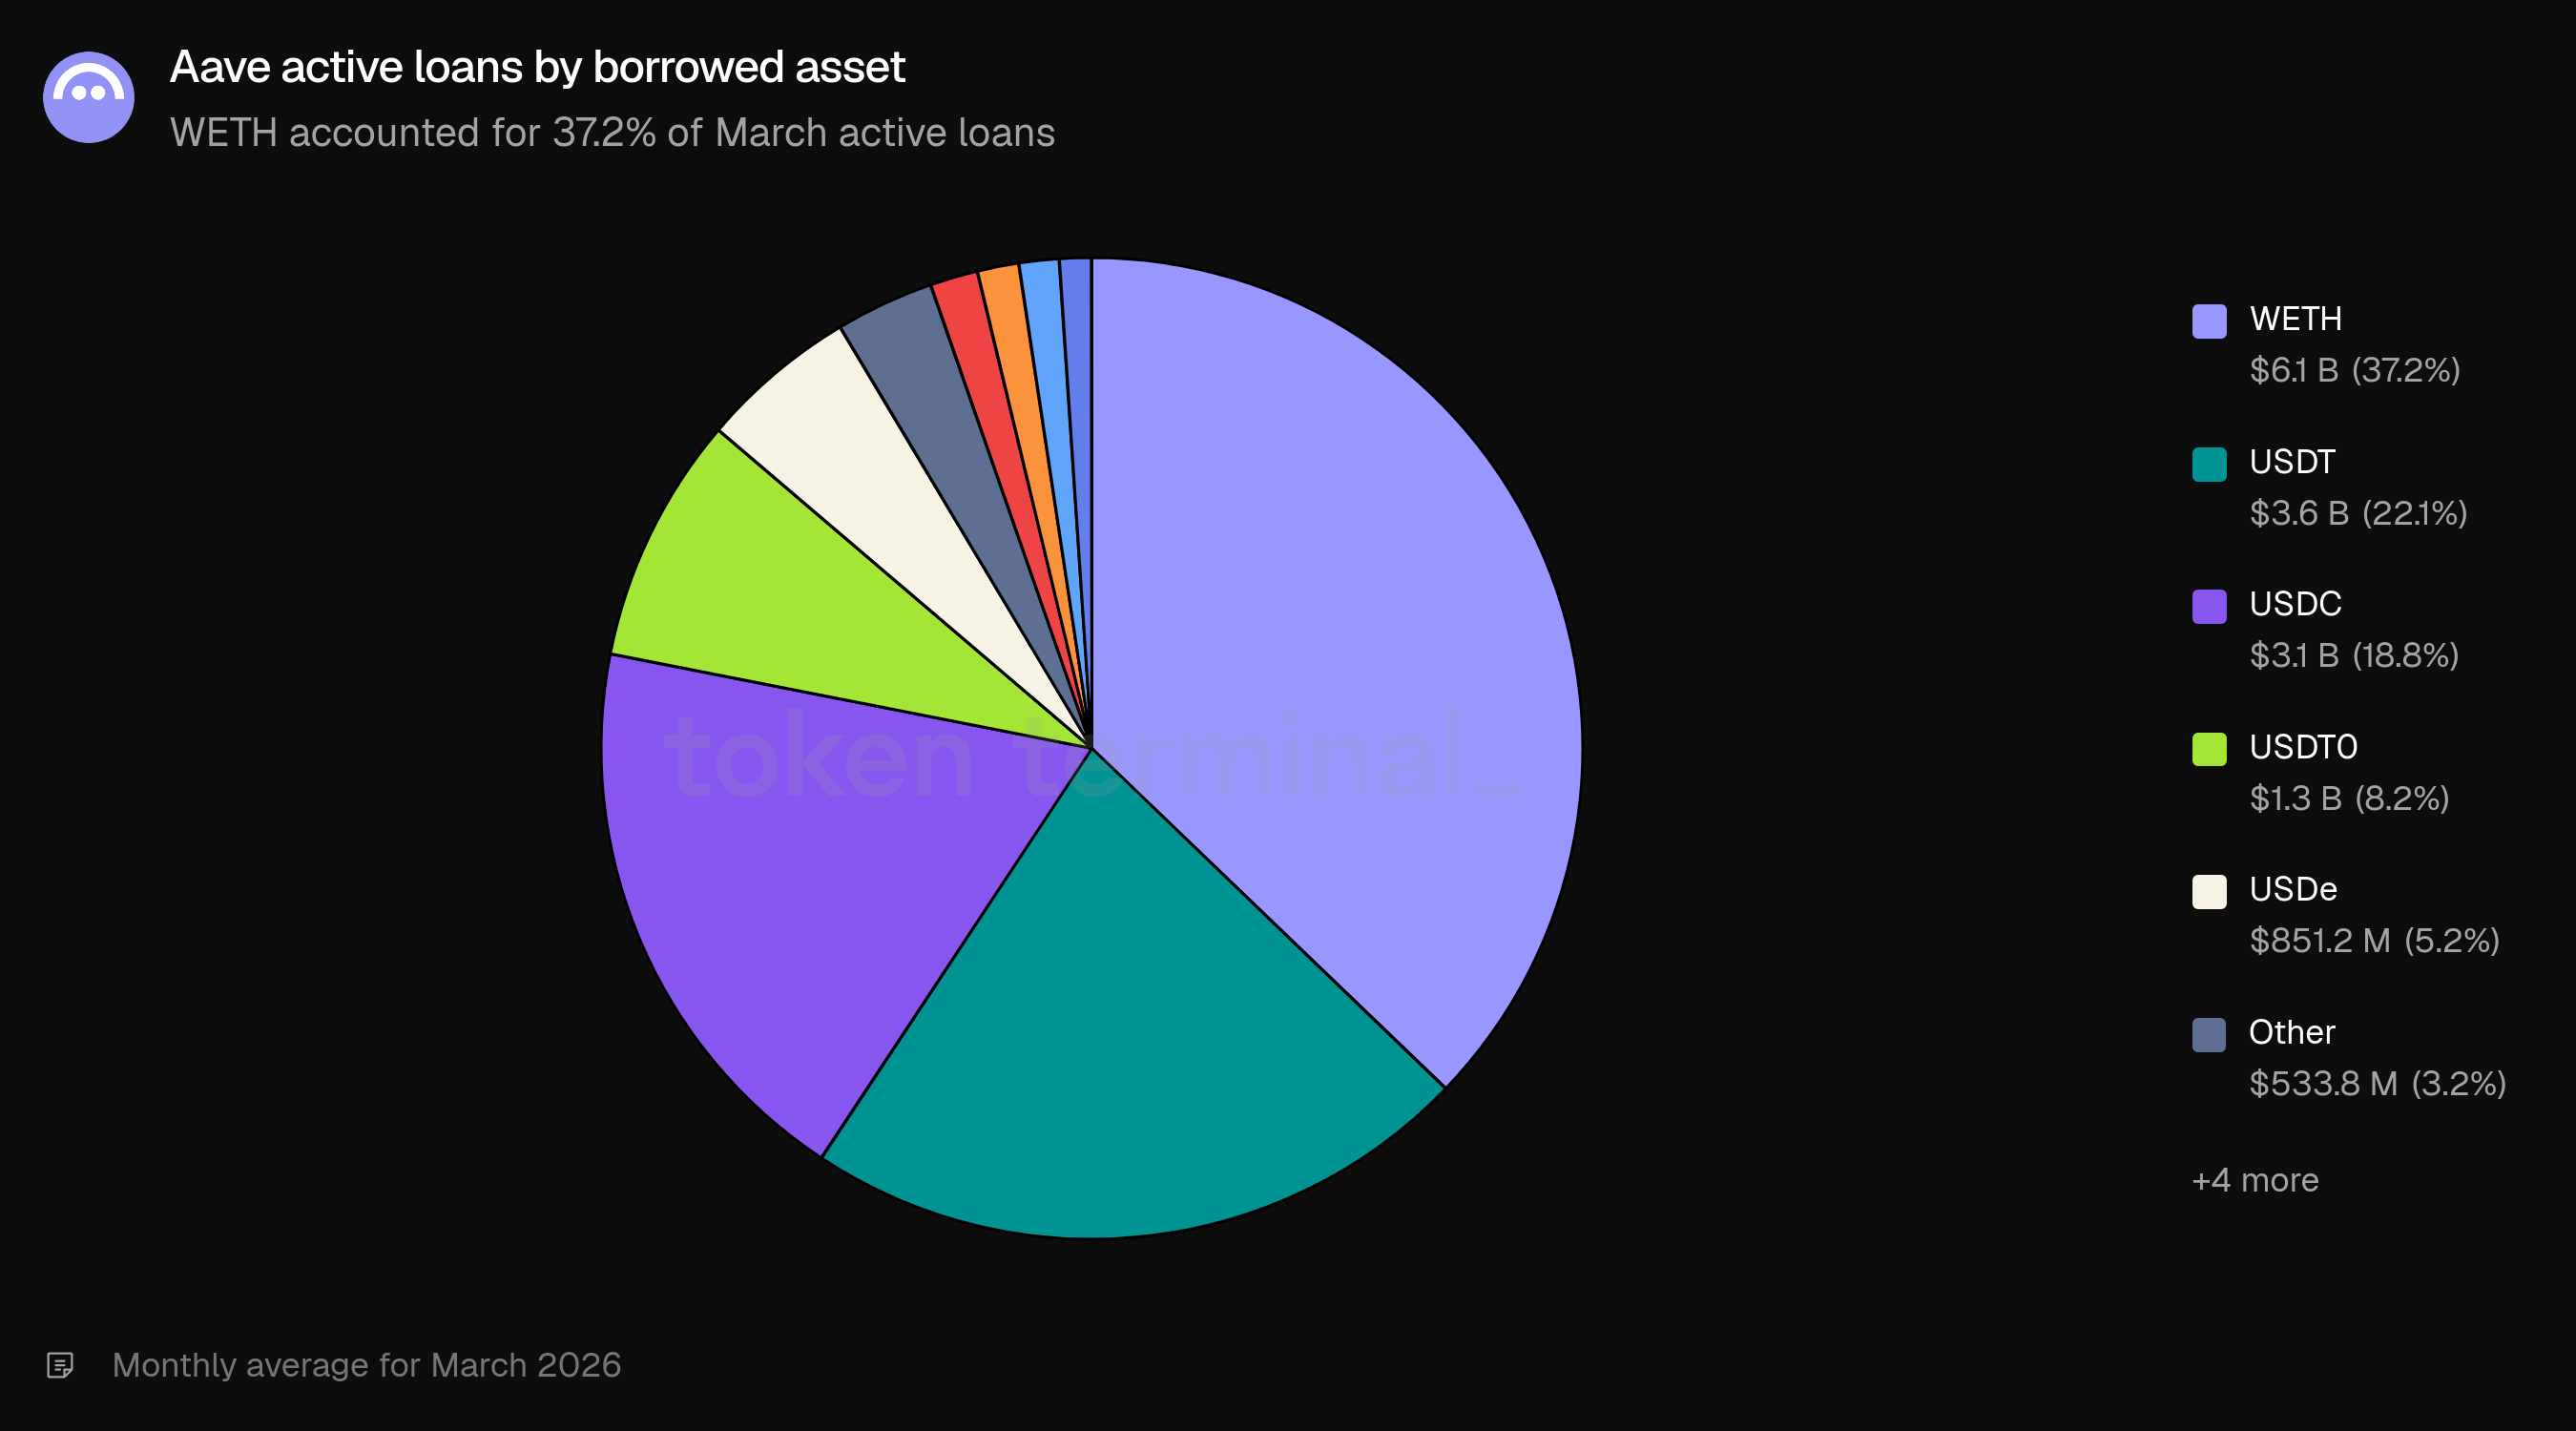
Borrows remained concentrated in a few assets. WETH led at 37.2% of active loans, followed by USDT (22.1%), USDC (18.8%), USDT0 (8.2%), and USDe (5.2%). The top three borrowed assets accounted for 78.1% of all outstanding loans. GHO appeared at 1.1% of active loans, representing borrowers minting Aave's native stablecoin against their collateral. The borrow composition was broadly stable from February, with WETH's share increasing modestly from 36.4%.
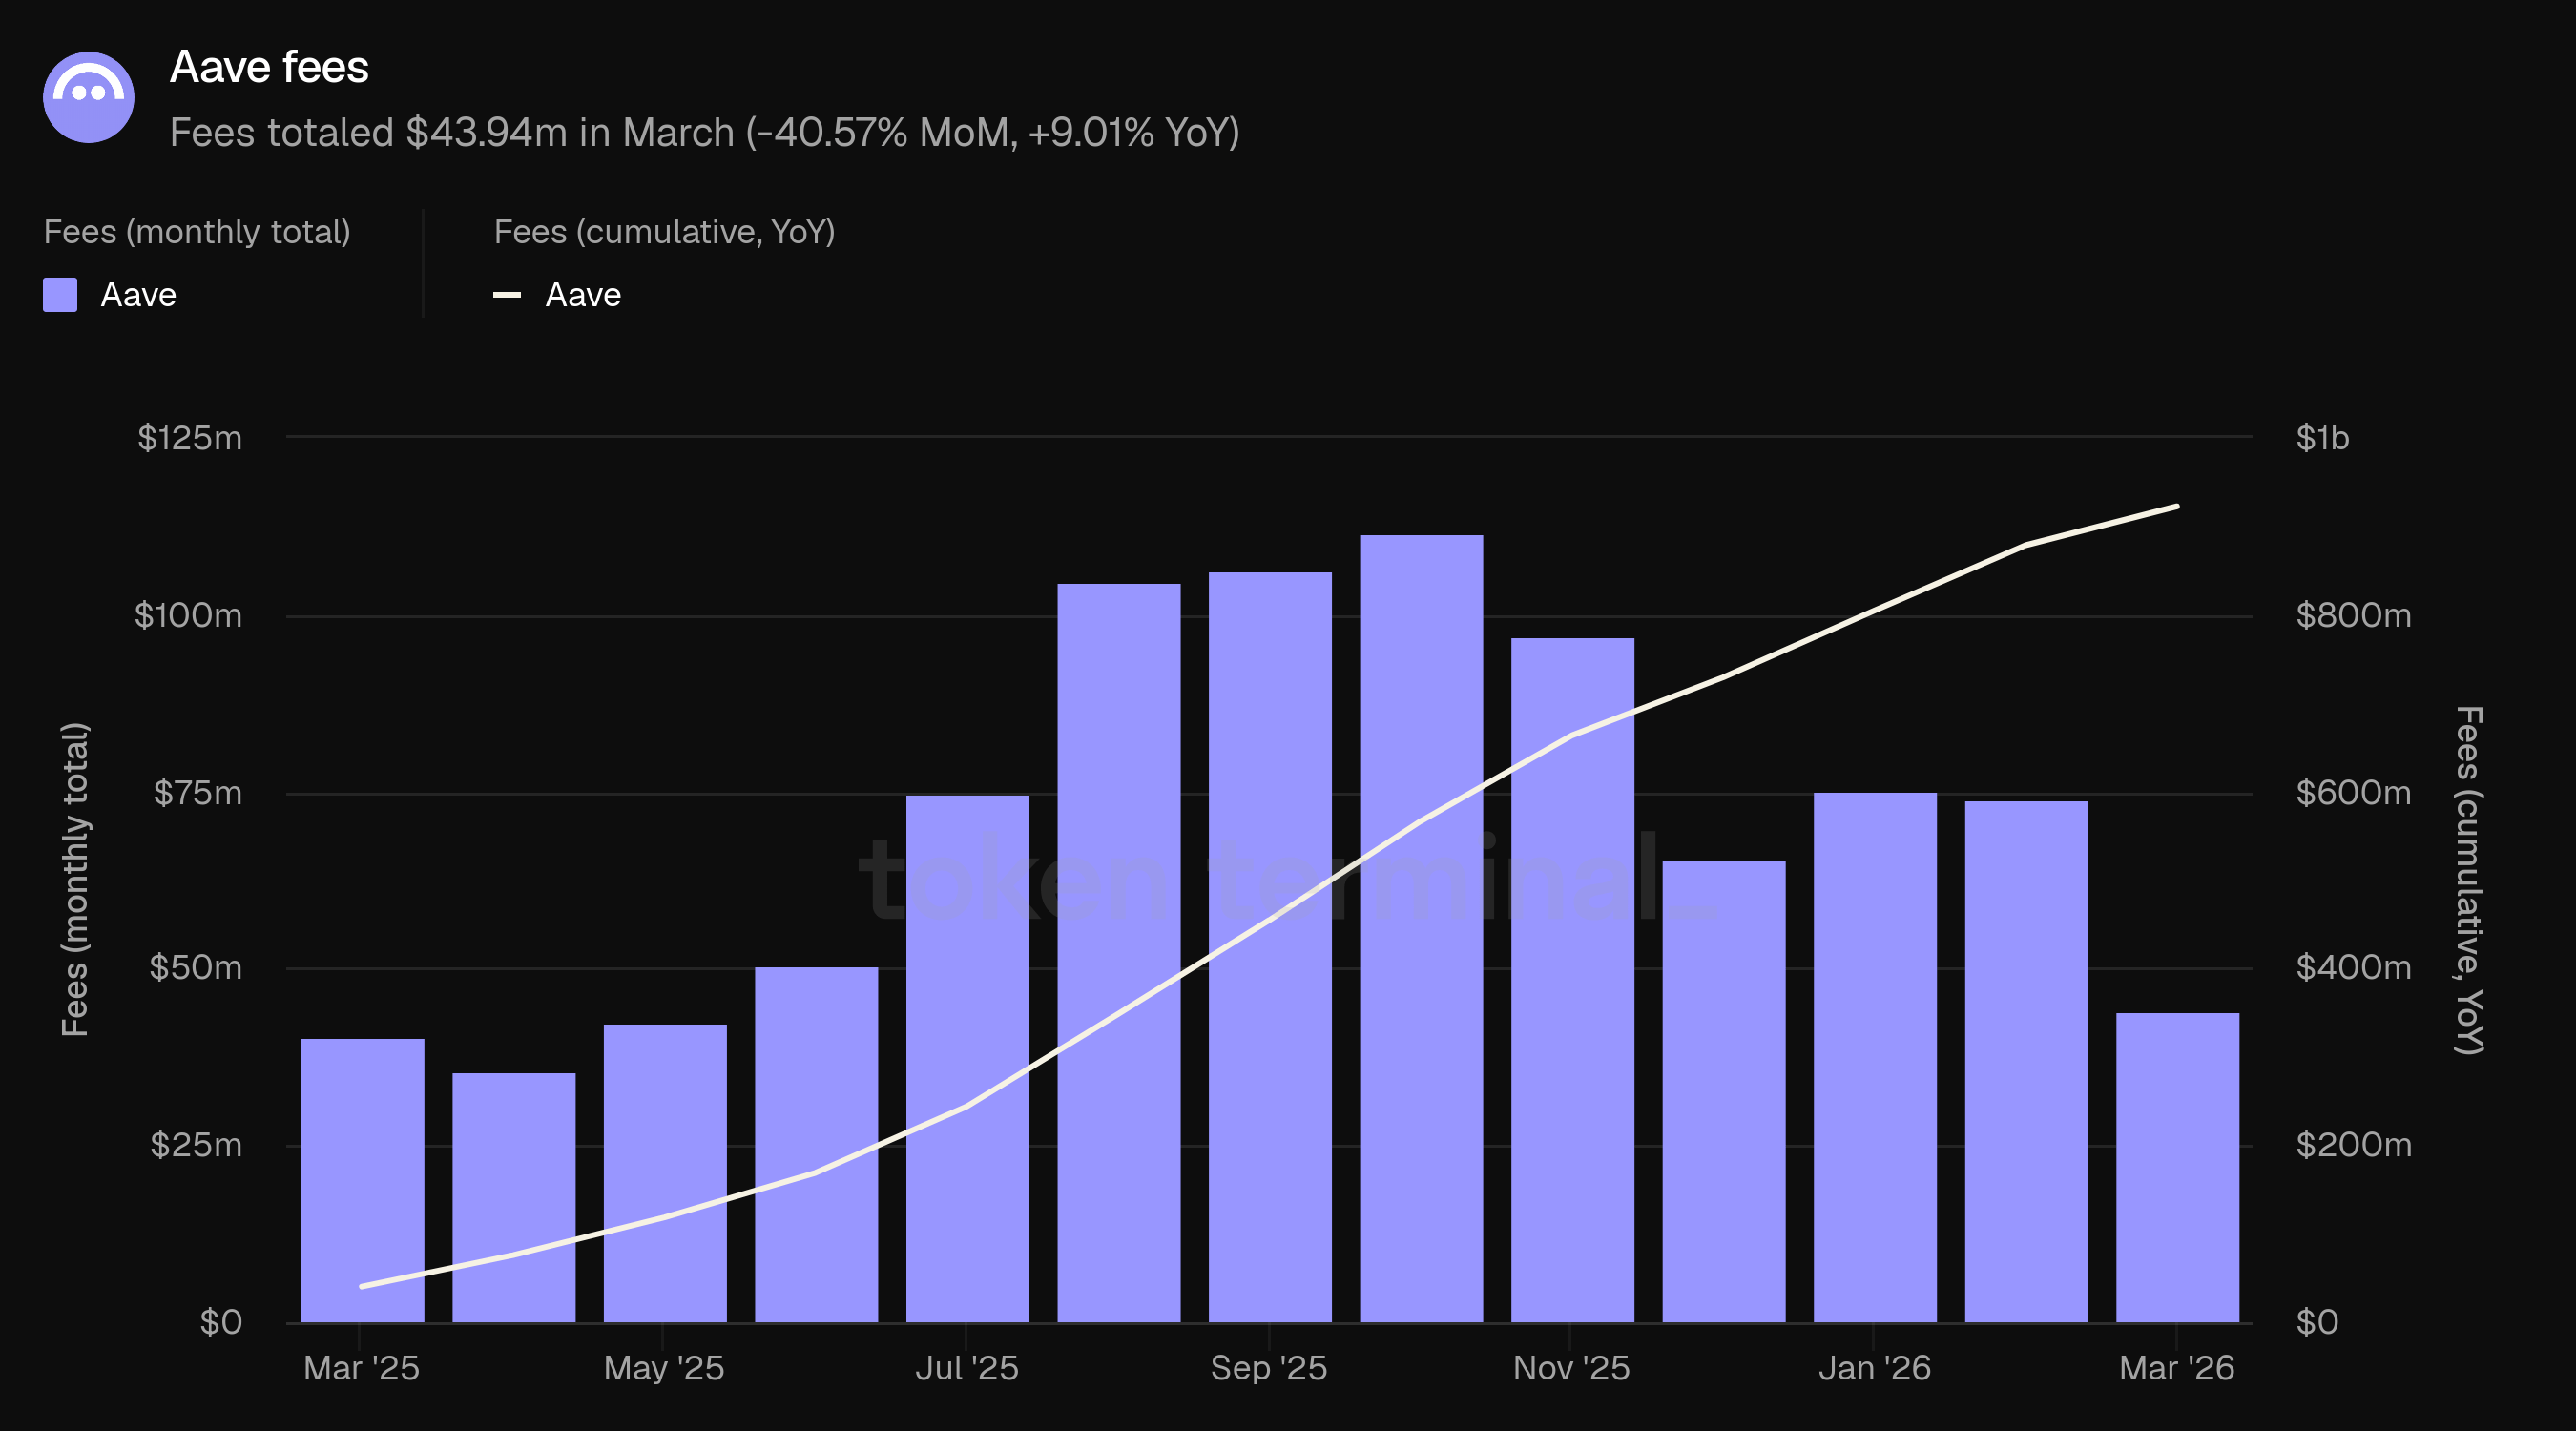
4) Fees
Fees measure the total USD value of fees paid by users across all of Aave's lending markets, aggregated across six income types: interest, liquidation, SVR, flash loan, treasury, and GHO stability module (see Definitions). March fees totaled $43.94m, down 40.57% from February's $73.94m but up 9.01% from March 2025's $40.31m. Cumulative fees from March 2025 to March 2026 reached $922.57m.
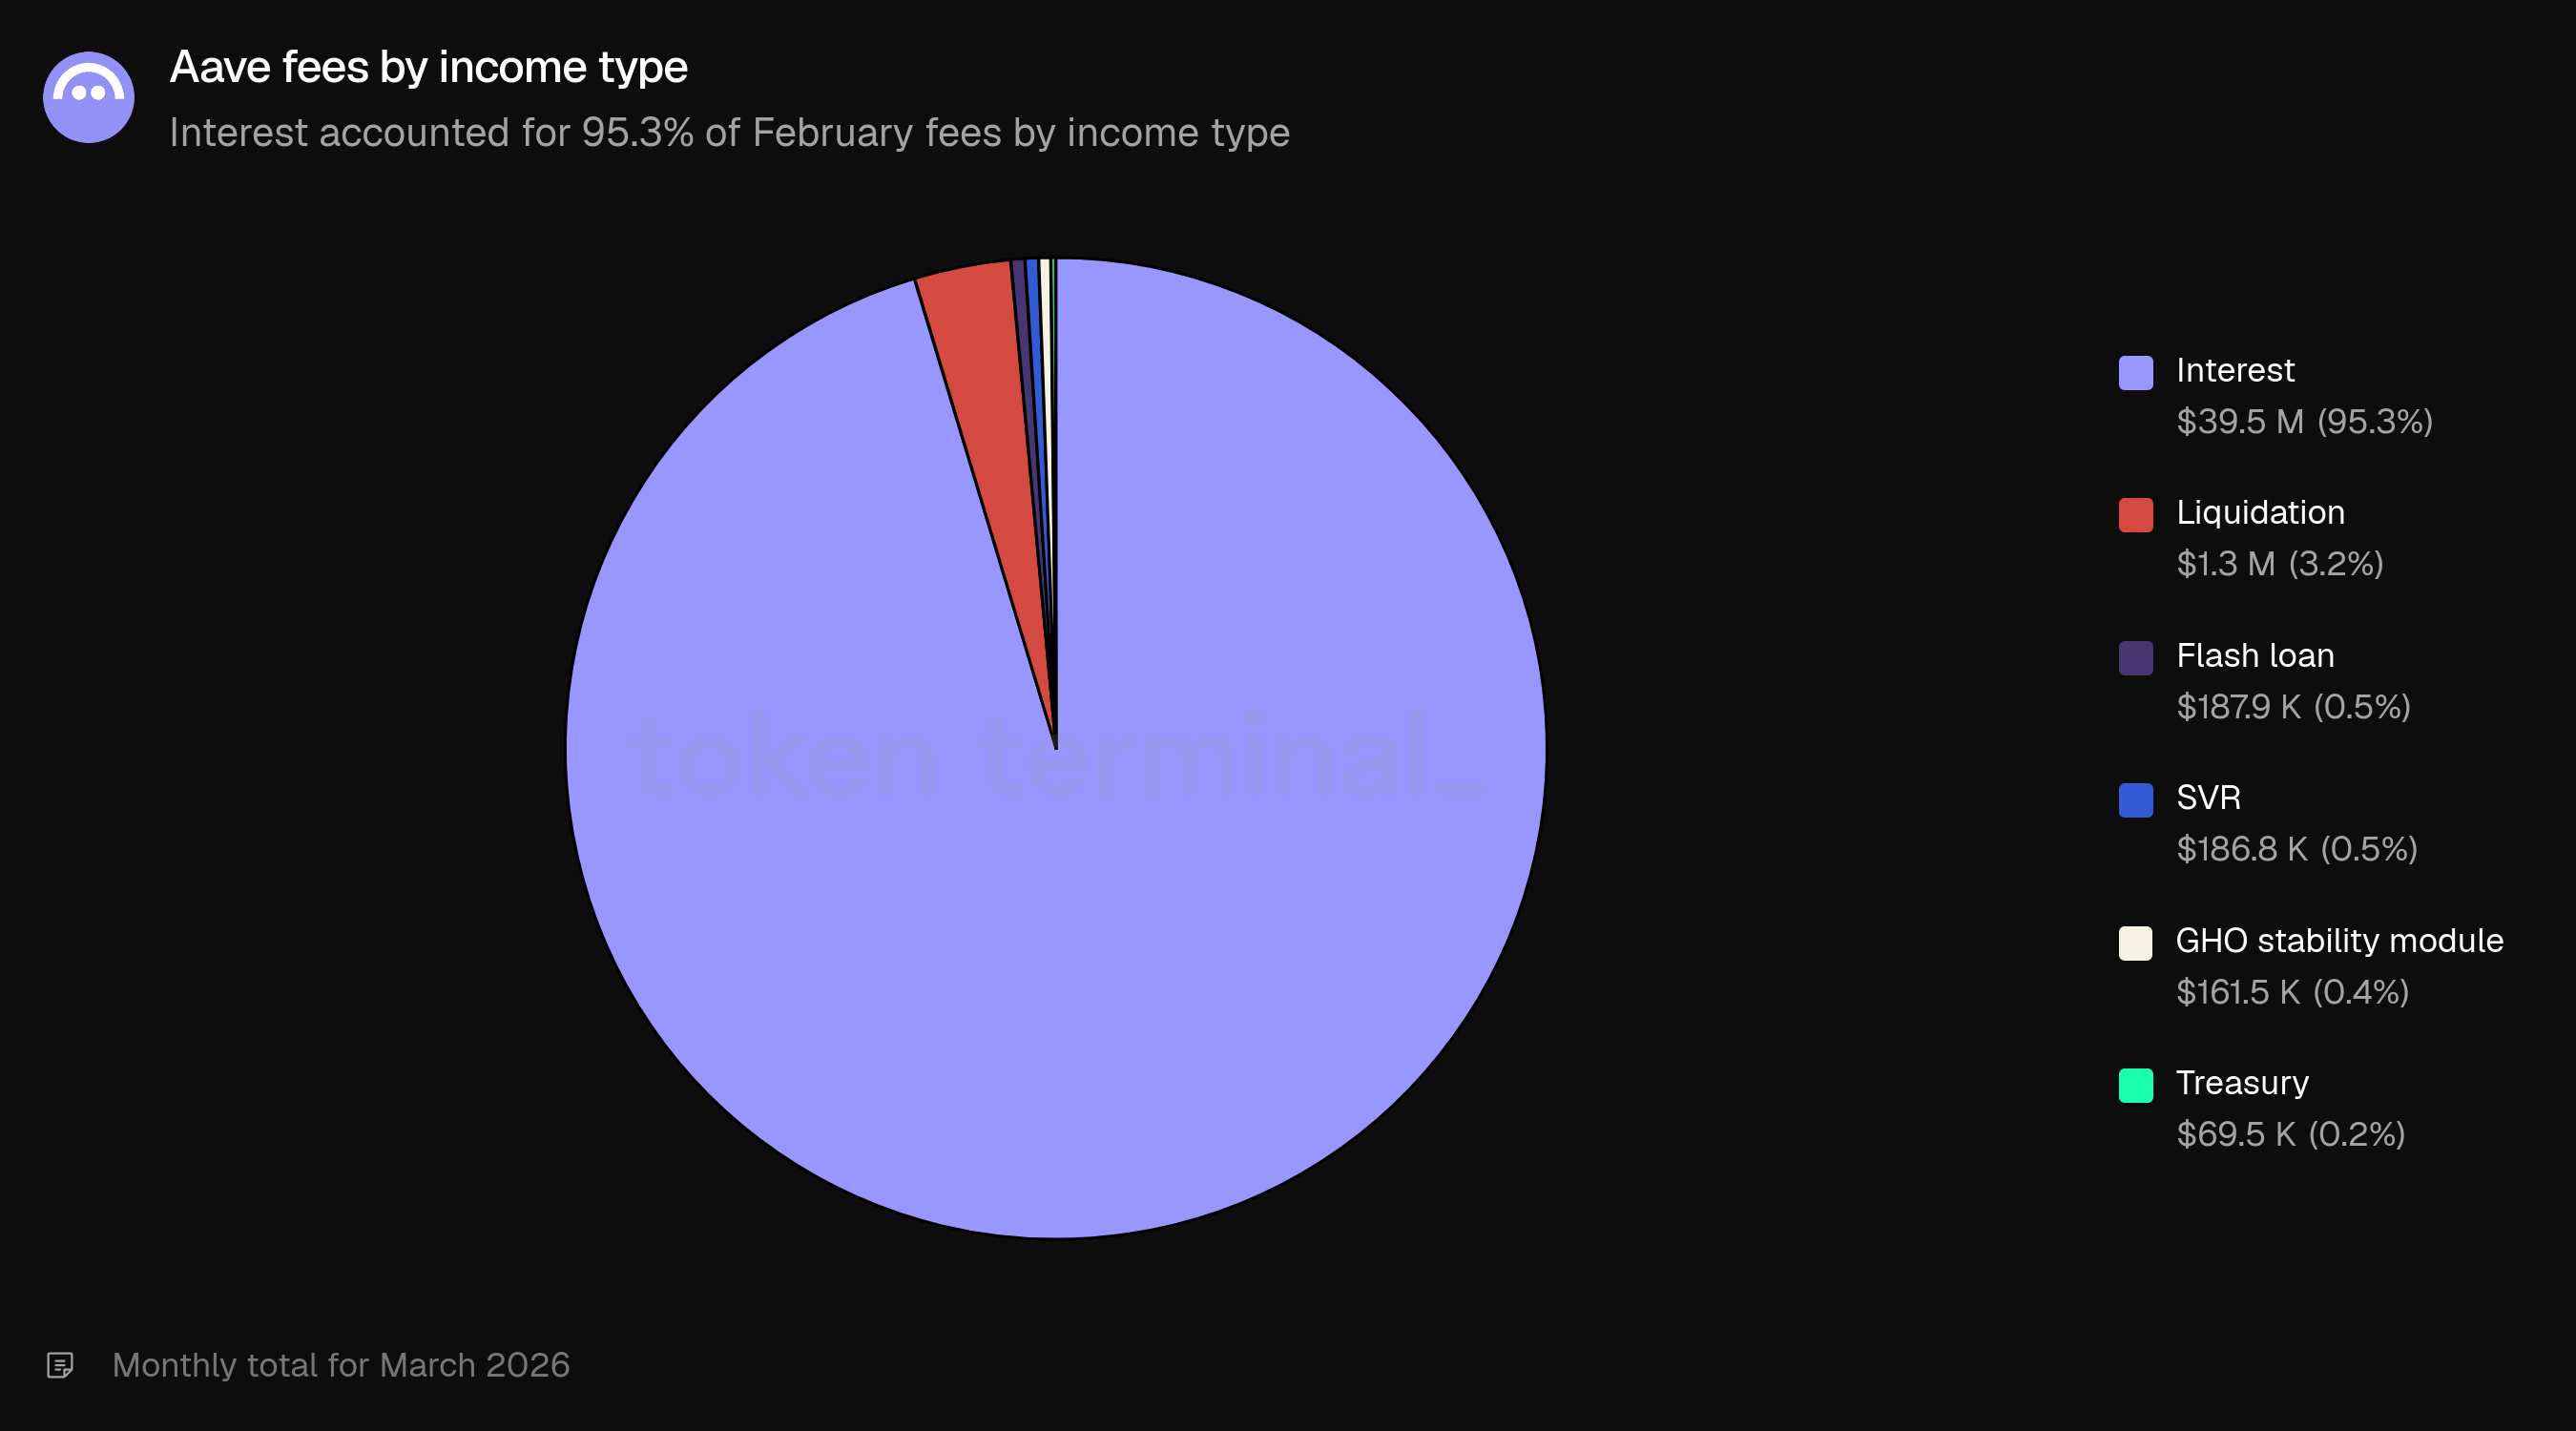
The headline 41% decline is driven primarily by the change in income composition. February's fee total included $18.6m in liquidation fees (25.1%) and $4.6m in SVR fees (6.2%), together contributing $23.1m in income tied to the market correction. In March, the income composition normalized: interest accounted for 95.3% of fees, with liquidation at 3.2% and SVR at 0.5%.
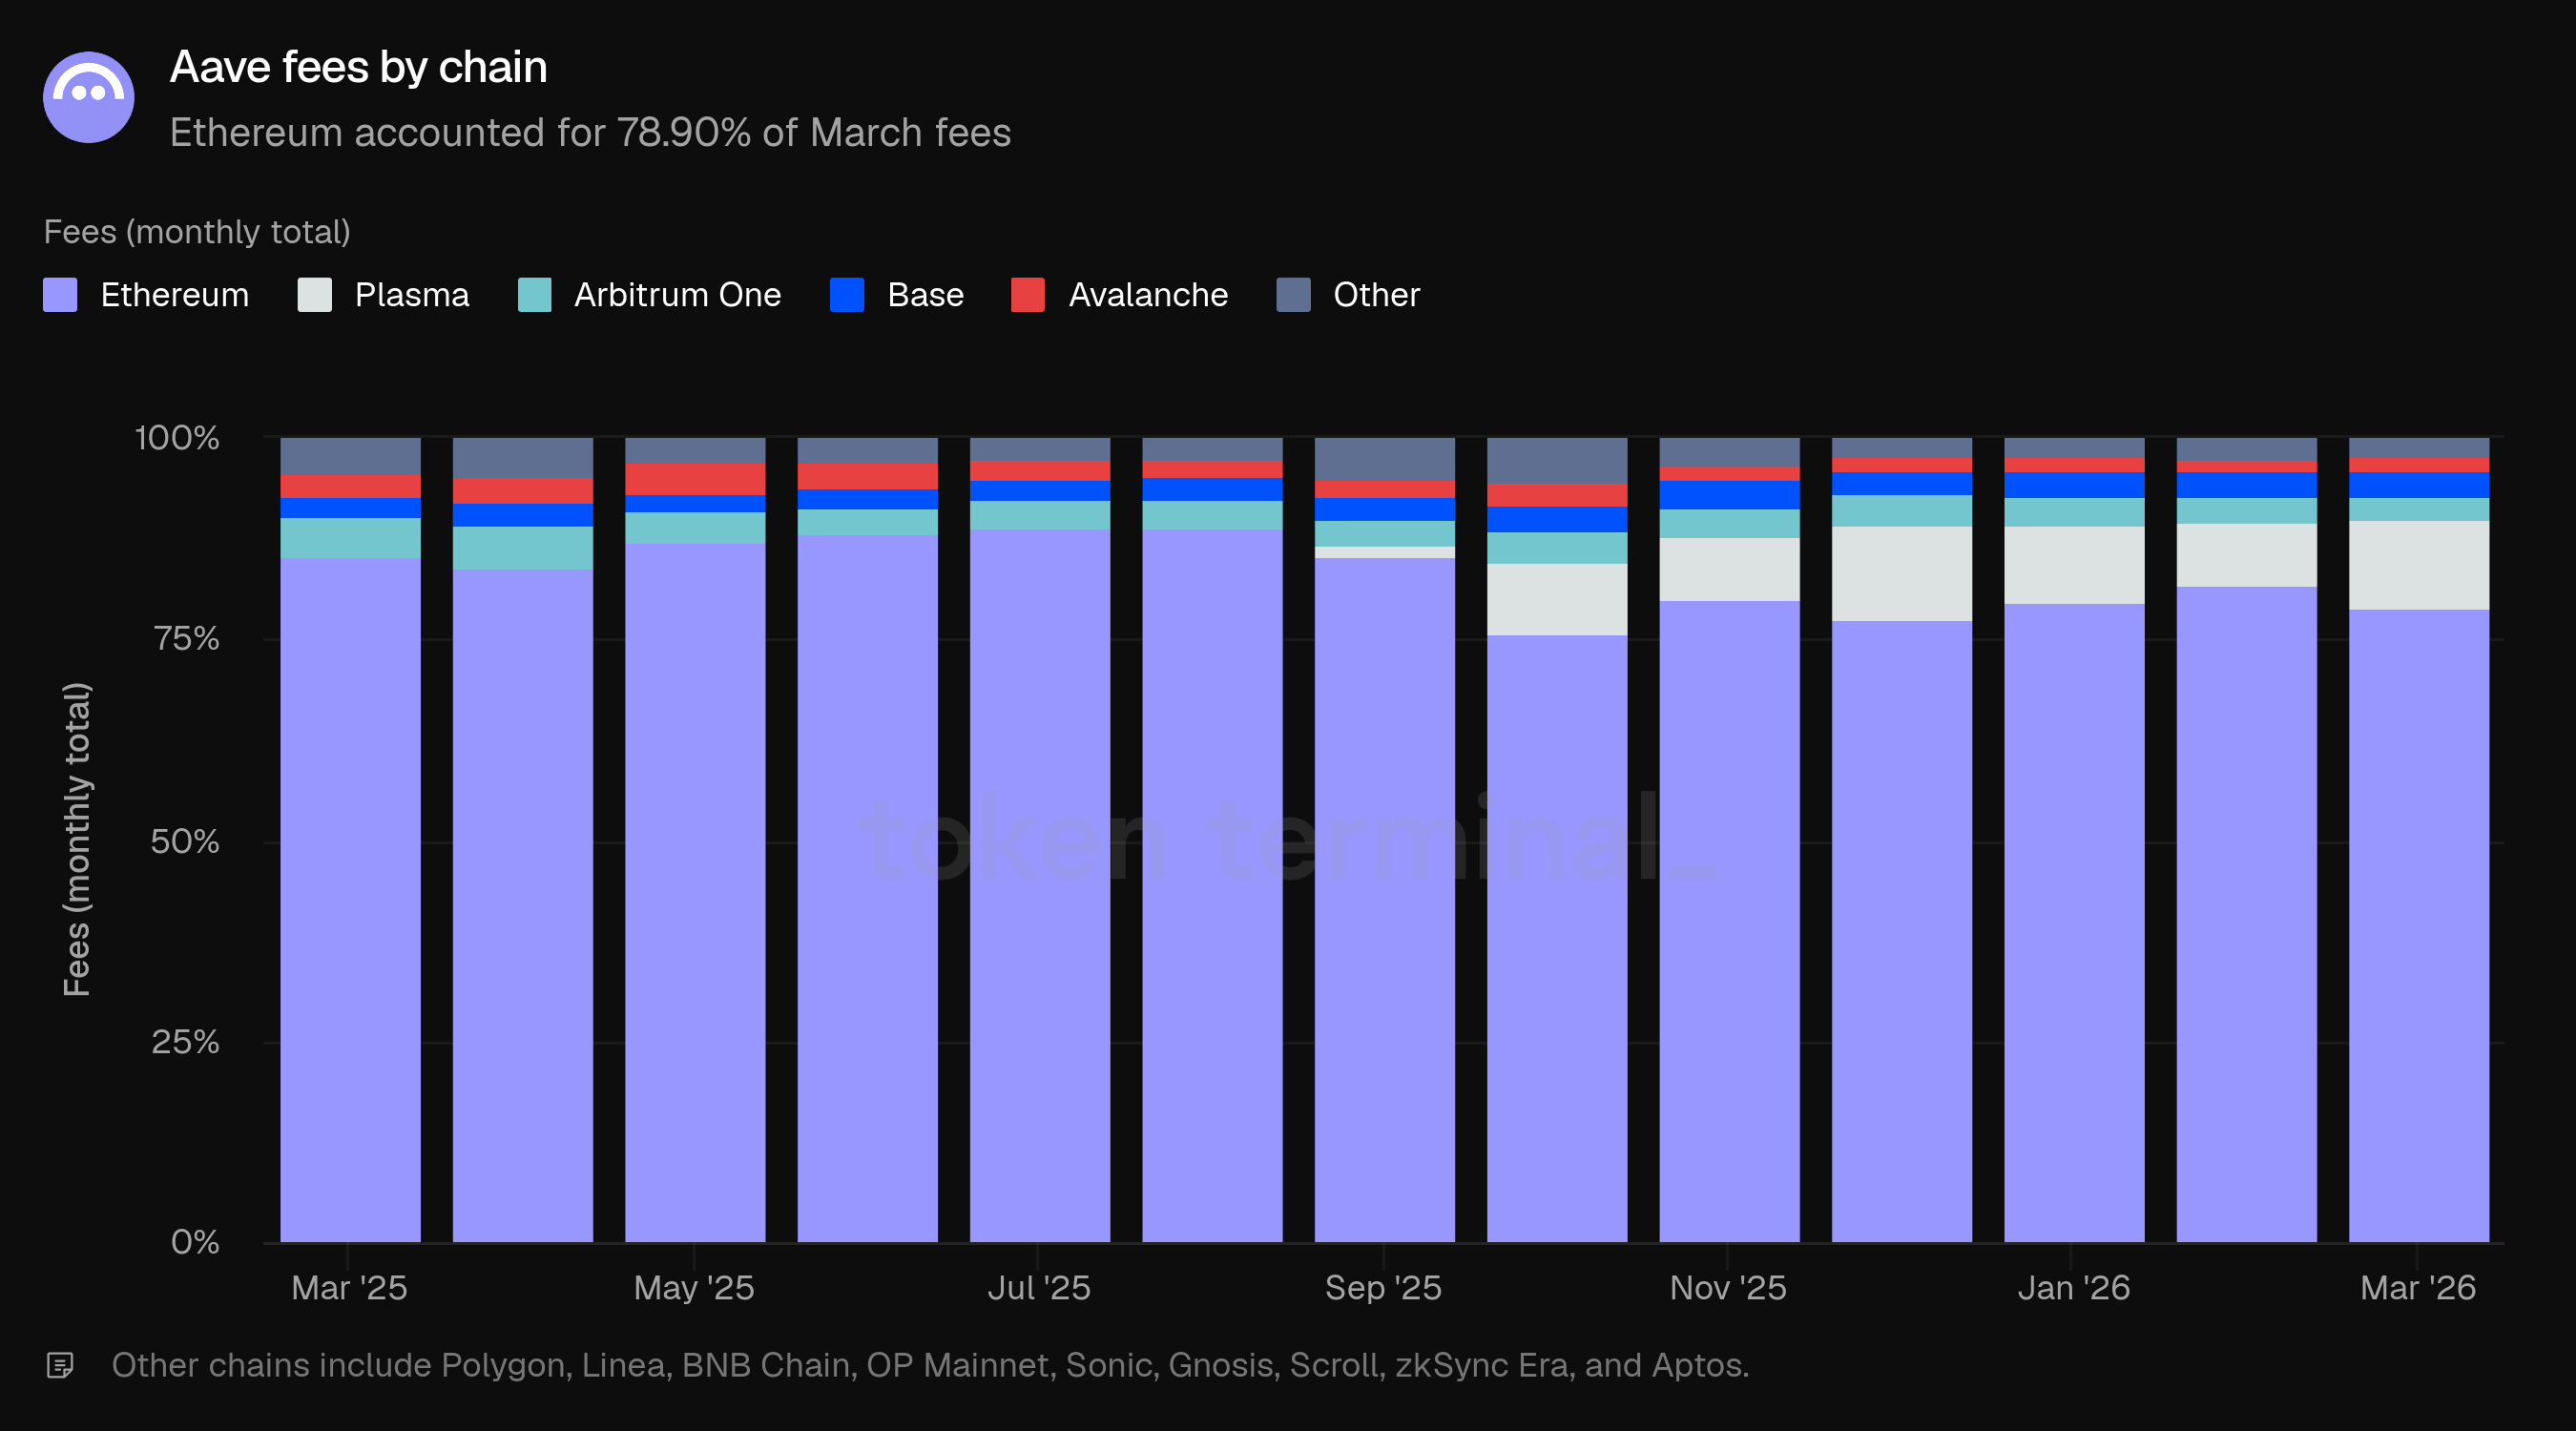
Ethereum accounted for 78.90% of March fees, down from 81.95% in February. February's liquidation and SVR activity was concentrated on Ethereum, where the largest positions reside. As those income sources receded in March, Ethereum's fee share moved closer to its TVL share (82.06%).
Plasma's fee share rose from 7.66% in February to 11.00% in March, despite its TVL share declining over the same period (9.05% to 8.45%). This divergence suggests elevated borrowing activity or higher utilization rates on the Plasma deployment. Base (3.49%), Arbitrum One (2.86%), and Avalanche (1.51%) rounded out the top contributors.
By income type, interest dominated at 95.3% ($39.5m), followed by liquidation at 3.2% ($1.3m), flash loan at 0.5% ($187.9k), SVR at 0.5% ($186.8k), GHO stability module at 0.4% ($161.5k), and treasury at 0.2% ($69.5k). The shift from February's 68.0% interest / 25.1% liquidation / 6.2% SVR split to March's 95.3% interest represents the full normalization of fee composition following the market correction.
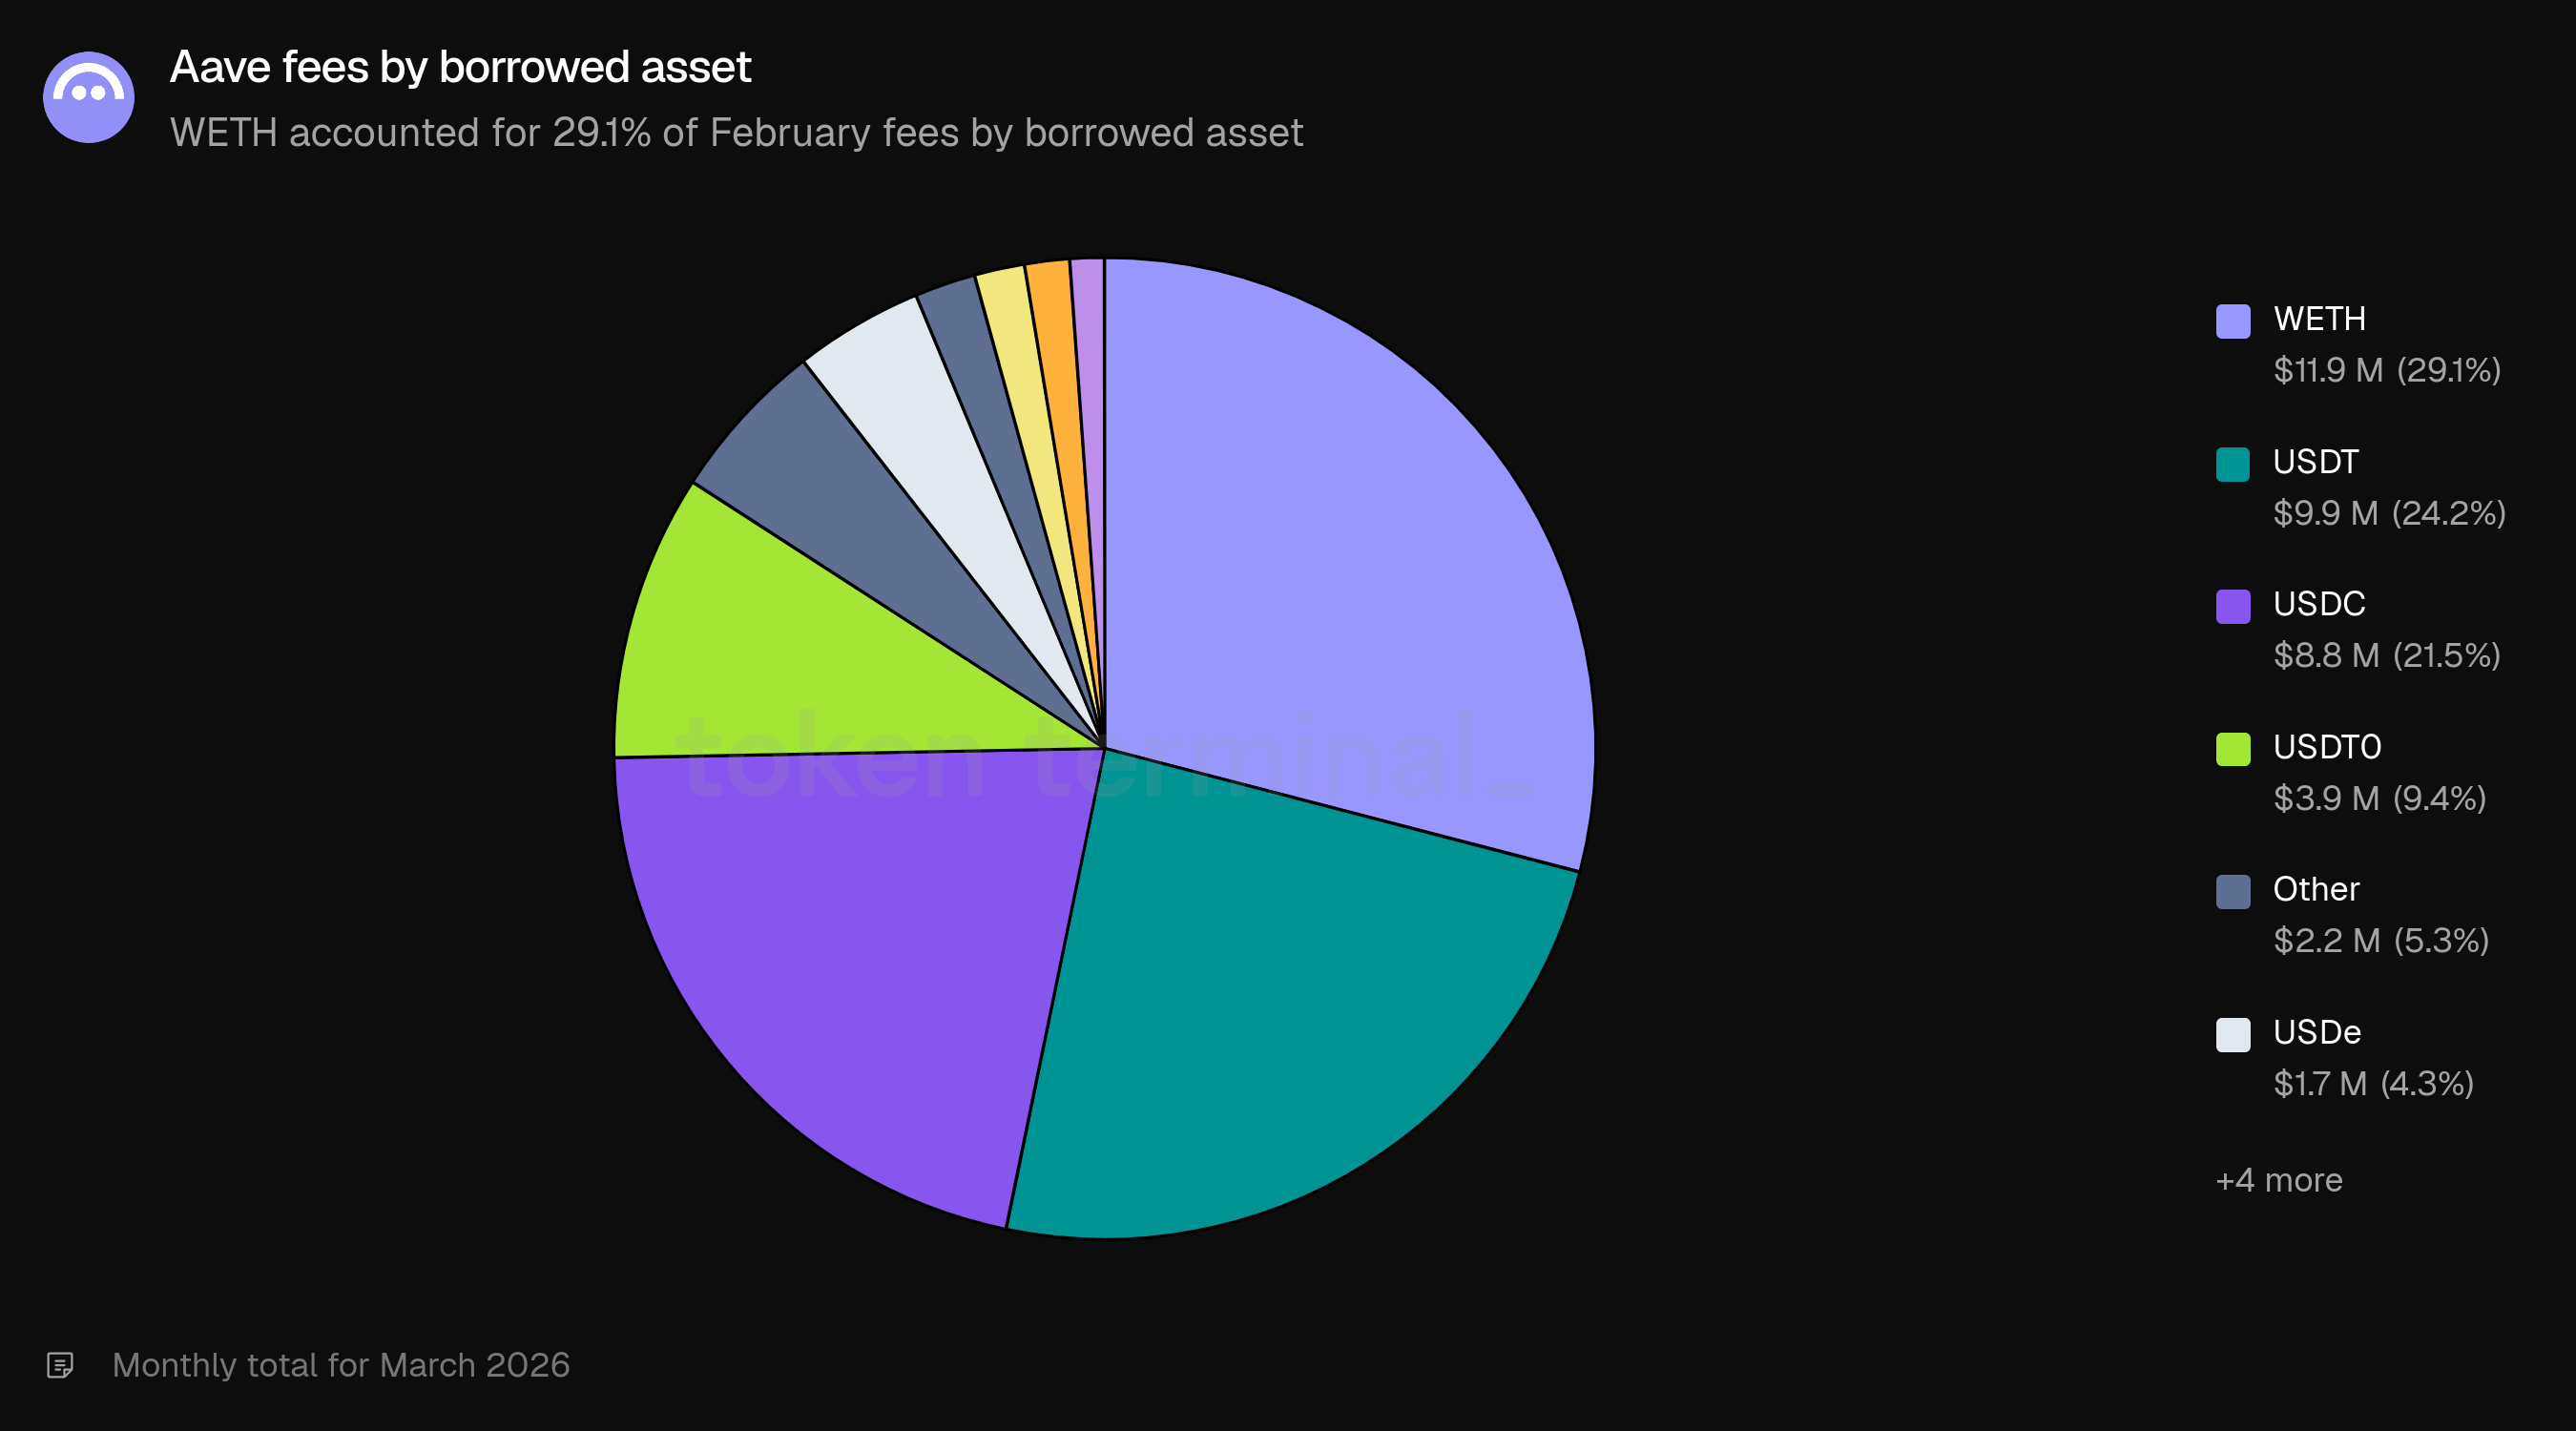
By borrowed asset, WETH accounted for 29.1% of fees, followed by USDT (24.2%), USDC (21.5%), USDT0 (9.4%), and other assets (5.3%). Stablecoin borrowing (USDT, USDC, USDT0) collectively generated 55.1% of fees.
5) Revenue
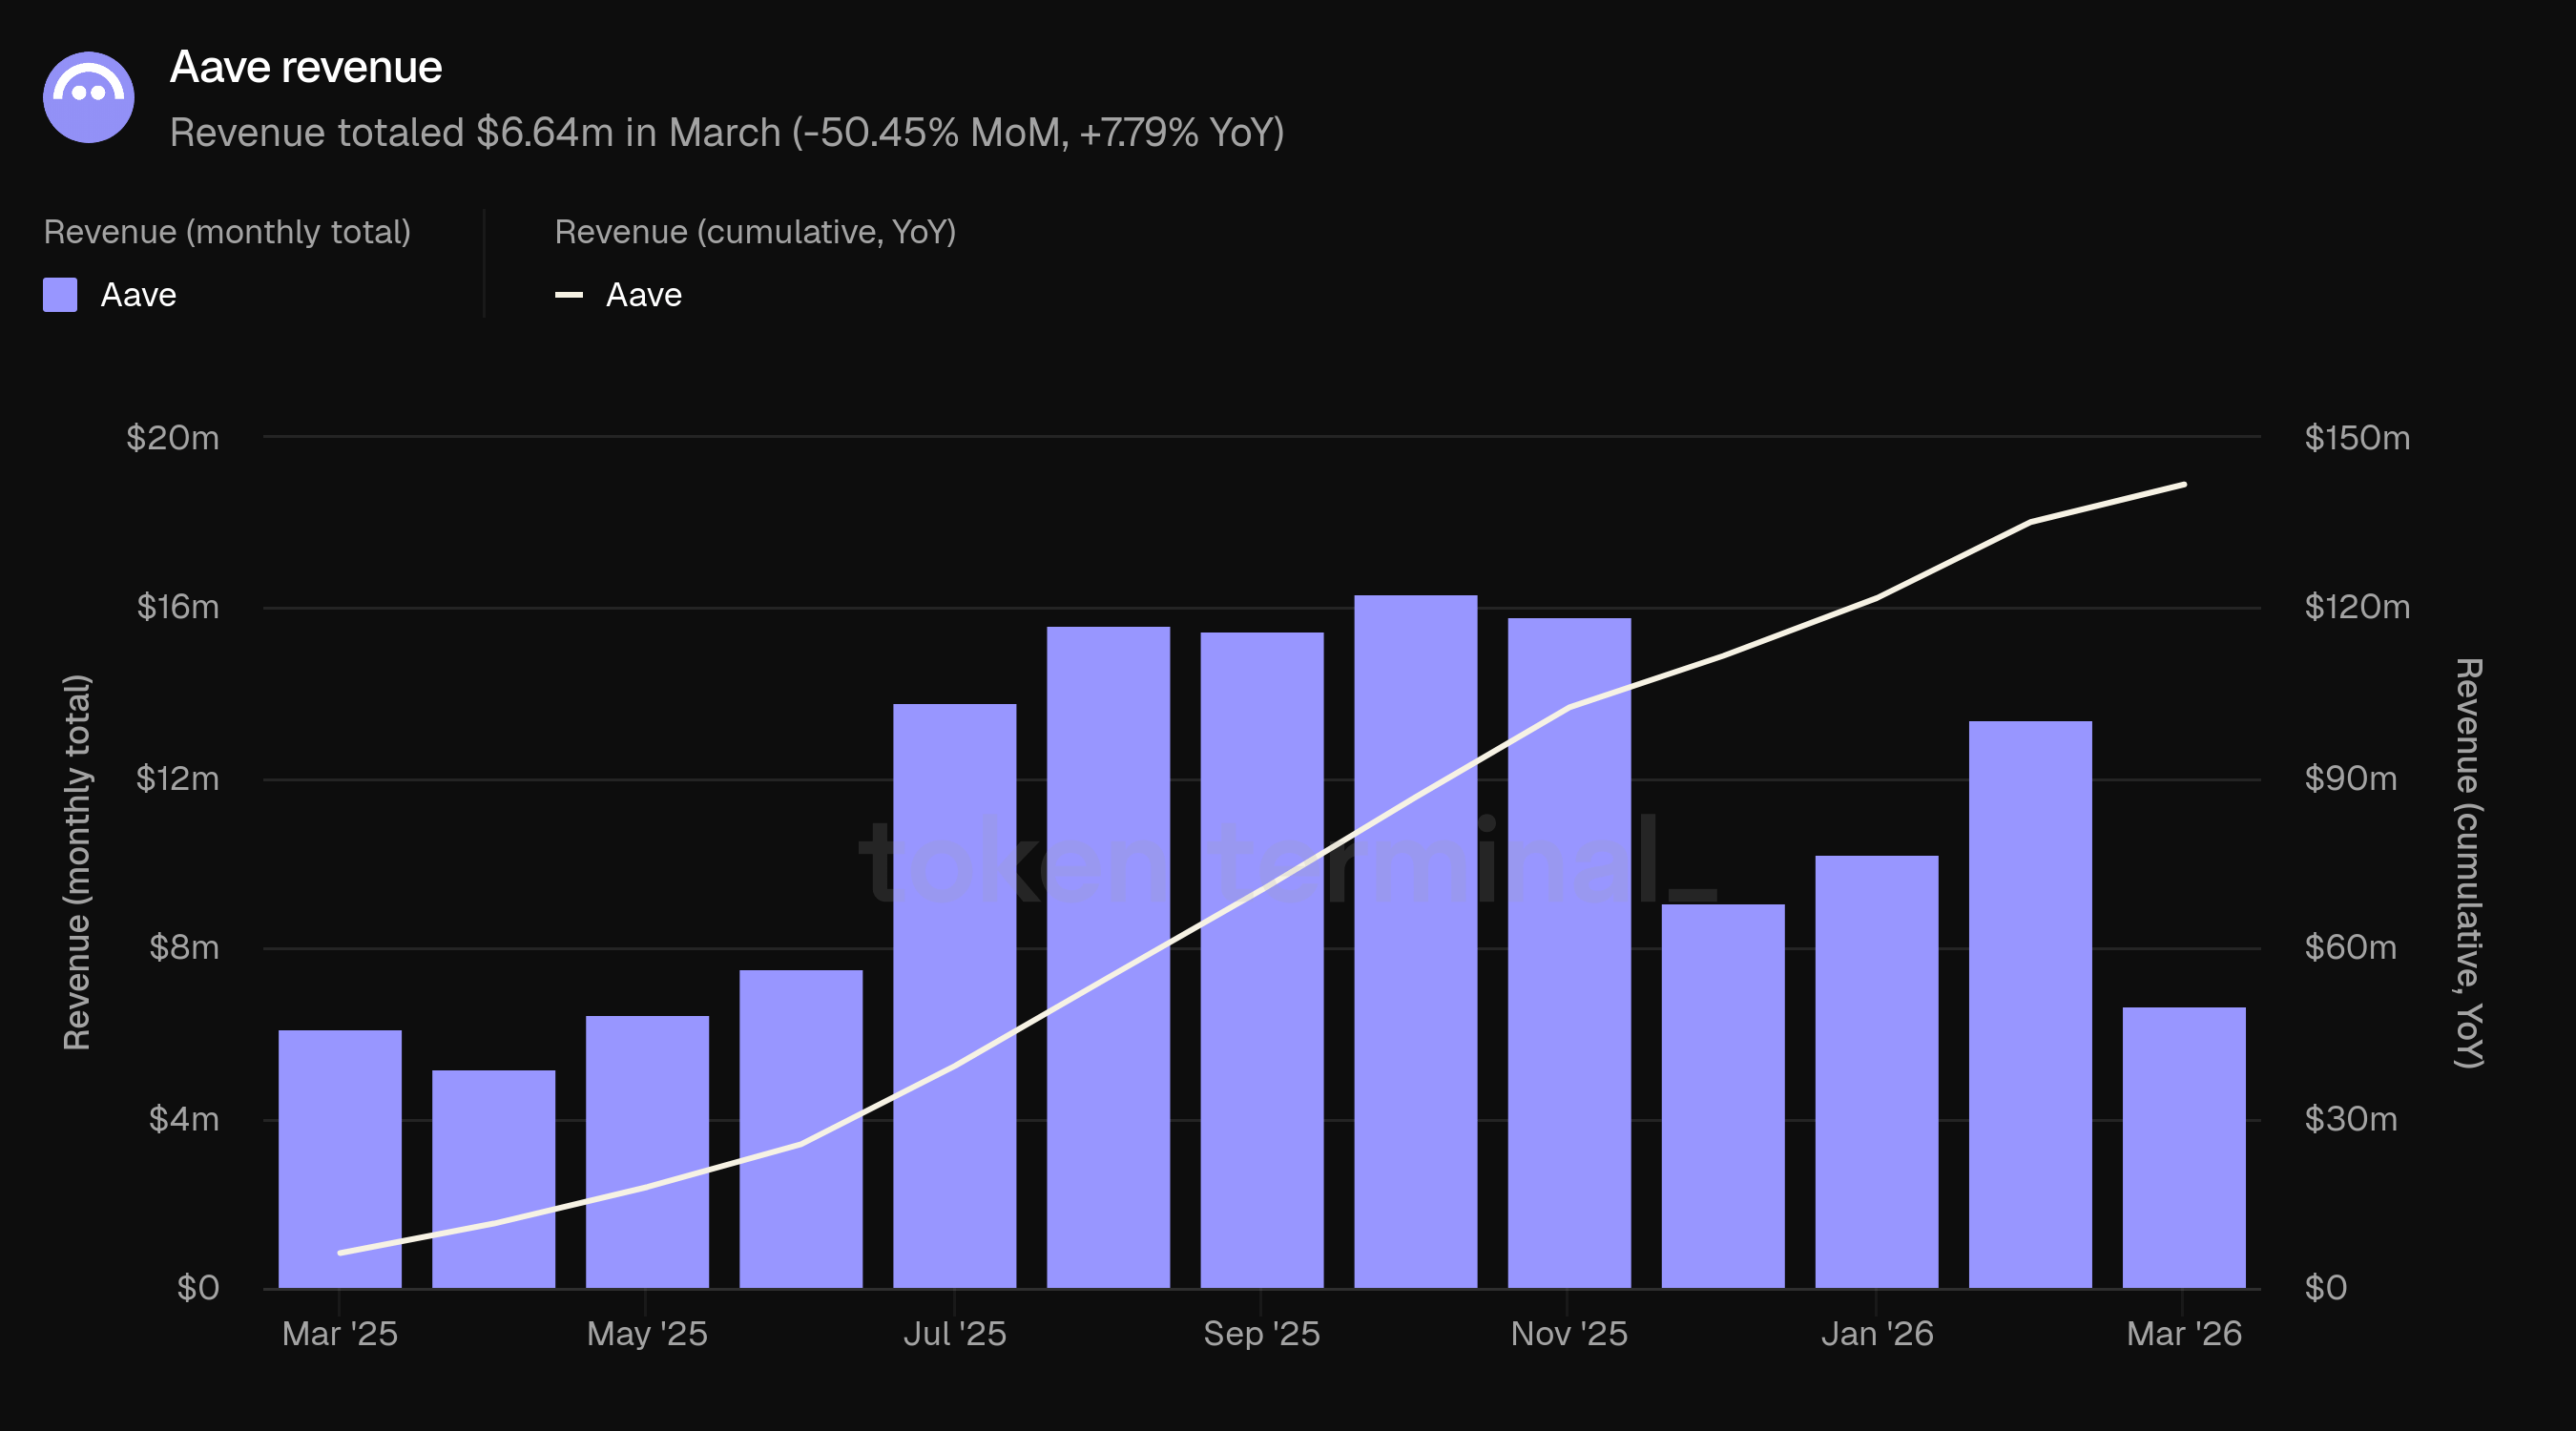
Revenue measures the total USD value of fees retained by the Aave DAO. March revenue totaled $6.64m, down 50.45% from February's $13.40m but up 7.79% from March 2025's $6.16m. Cumulative revenue from March 2025 to March 2026 reached $141.79m.
The revenue decline was steeper than the fee decline (-50.45% vs. -40.57%) because the income types that drove February's elevated revenue carried disproportionately high take rates. SVR, which accounted for 34.3% of February revenue ($4.6m), dropped to 3.0% in March ($186.8k). Liquidation revenue fell from 13.9% ($1.9m) to 2.2% ($137.1k). Together, these two sources contributed $6.5m in February and $324k in March. Interest revenue declined from approximately $6.8m to $5.7m (-16.6%).
The overall take rate (revenue as a share of fees) was 15.11% in March, down from 18.12% in February. The decline is explained by the compositional shift: February's elevated take rate reflected the high-margin nature of liquidation and SVR income. The interest-only take rate was approximately 14.3% in March compared to 13.5% in February.
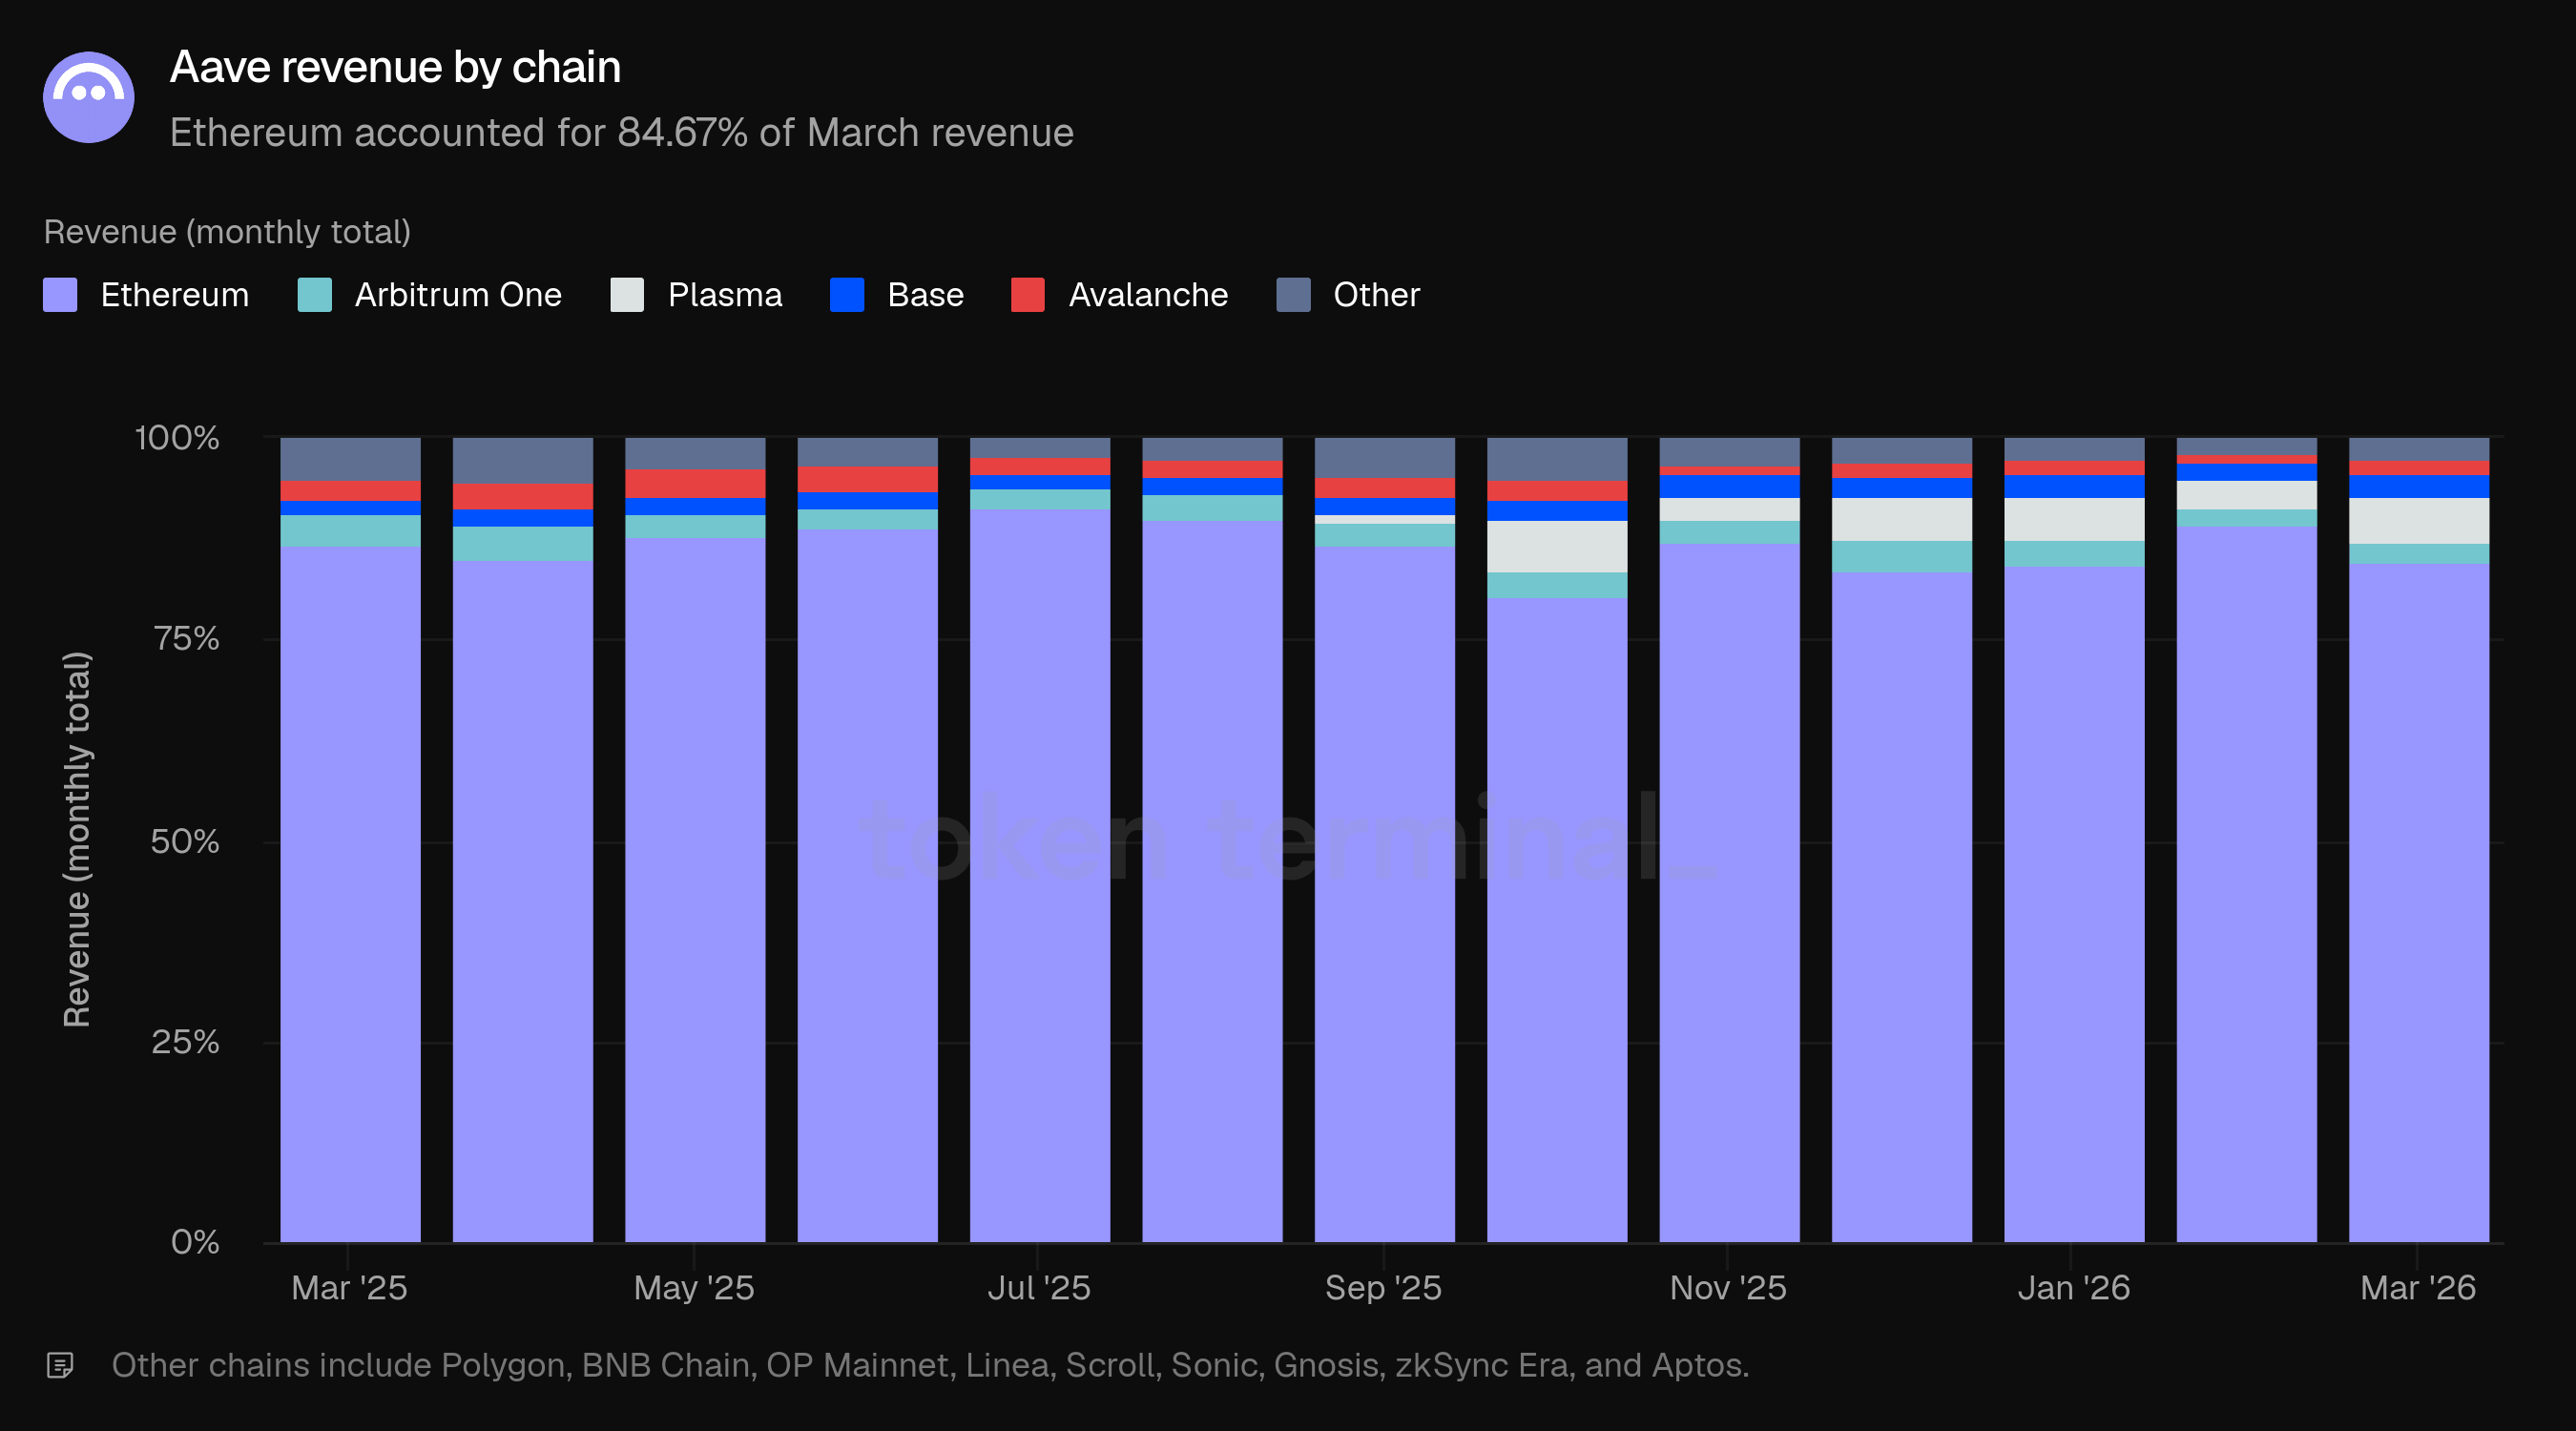
Ethereum accounted for 84.67% of March revenue, down from 89.33% in February. February's Ethereum-concentrated liquidation and SVR activity inflated its revenue share. As those sources receded, revenue distribution moved closer to the fee distribution. Plasma's share rose from 3.49% to 5.73%, followed by Base (2.77%), Arbitrum One (2.63%), Avalanche (1.60%), and other chains (2.60%).
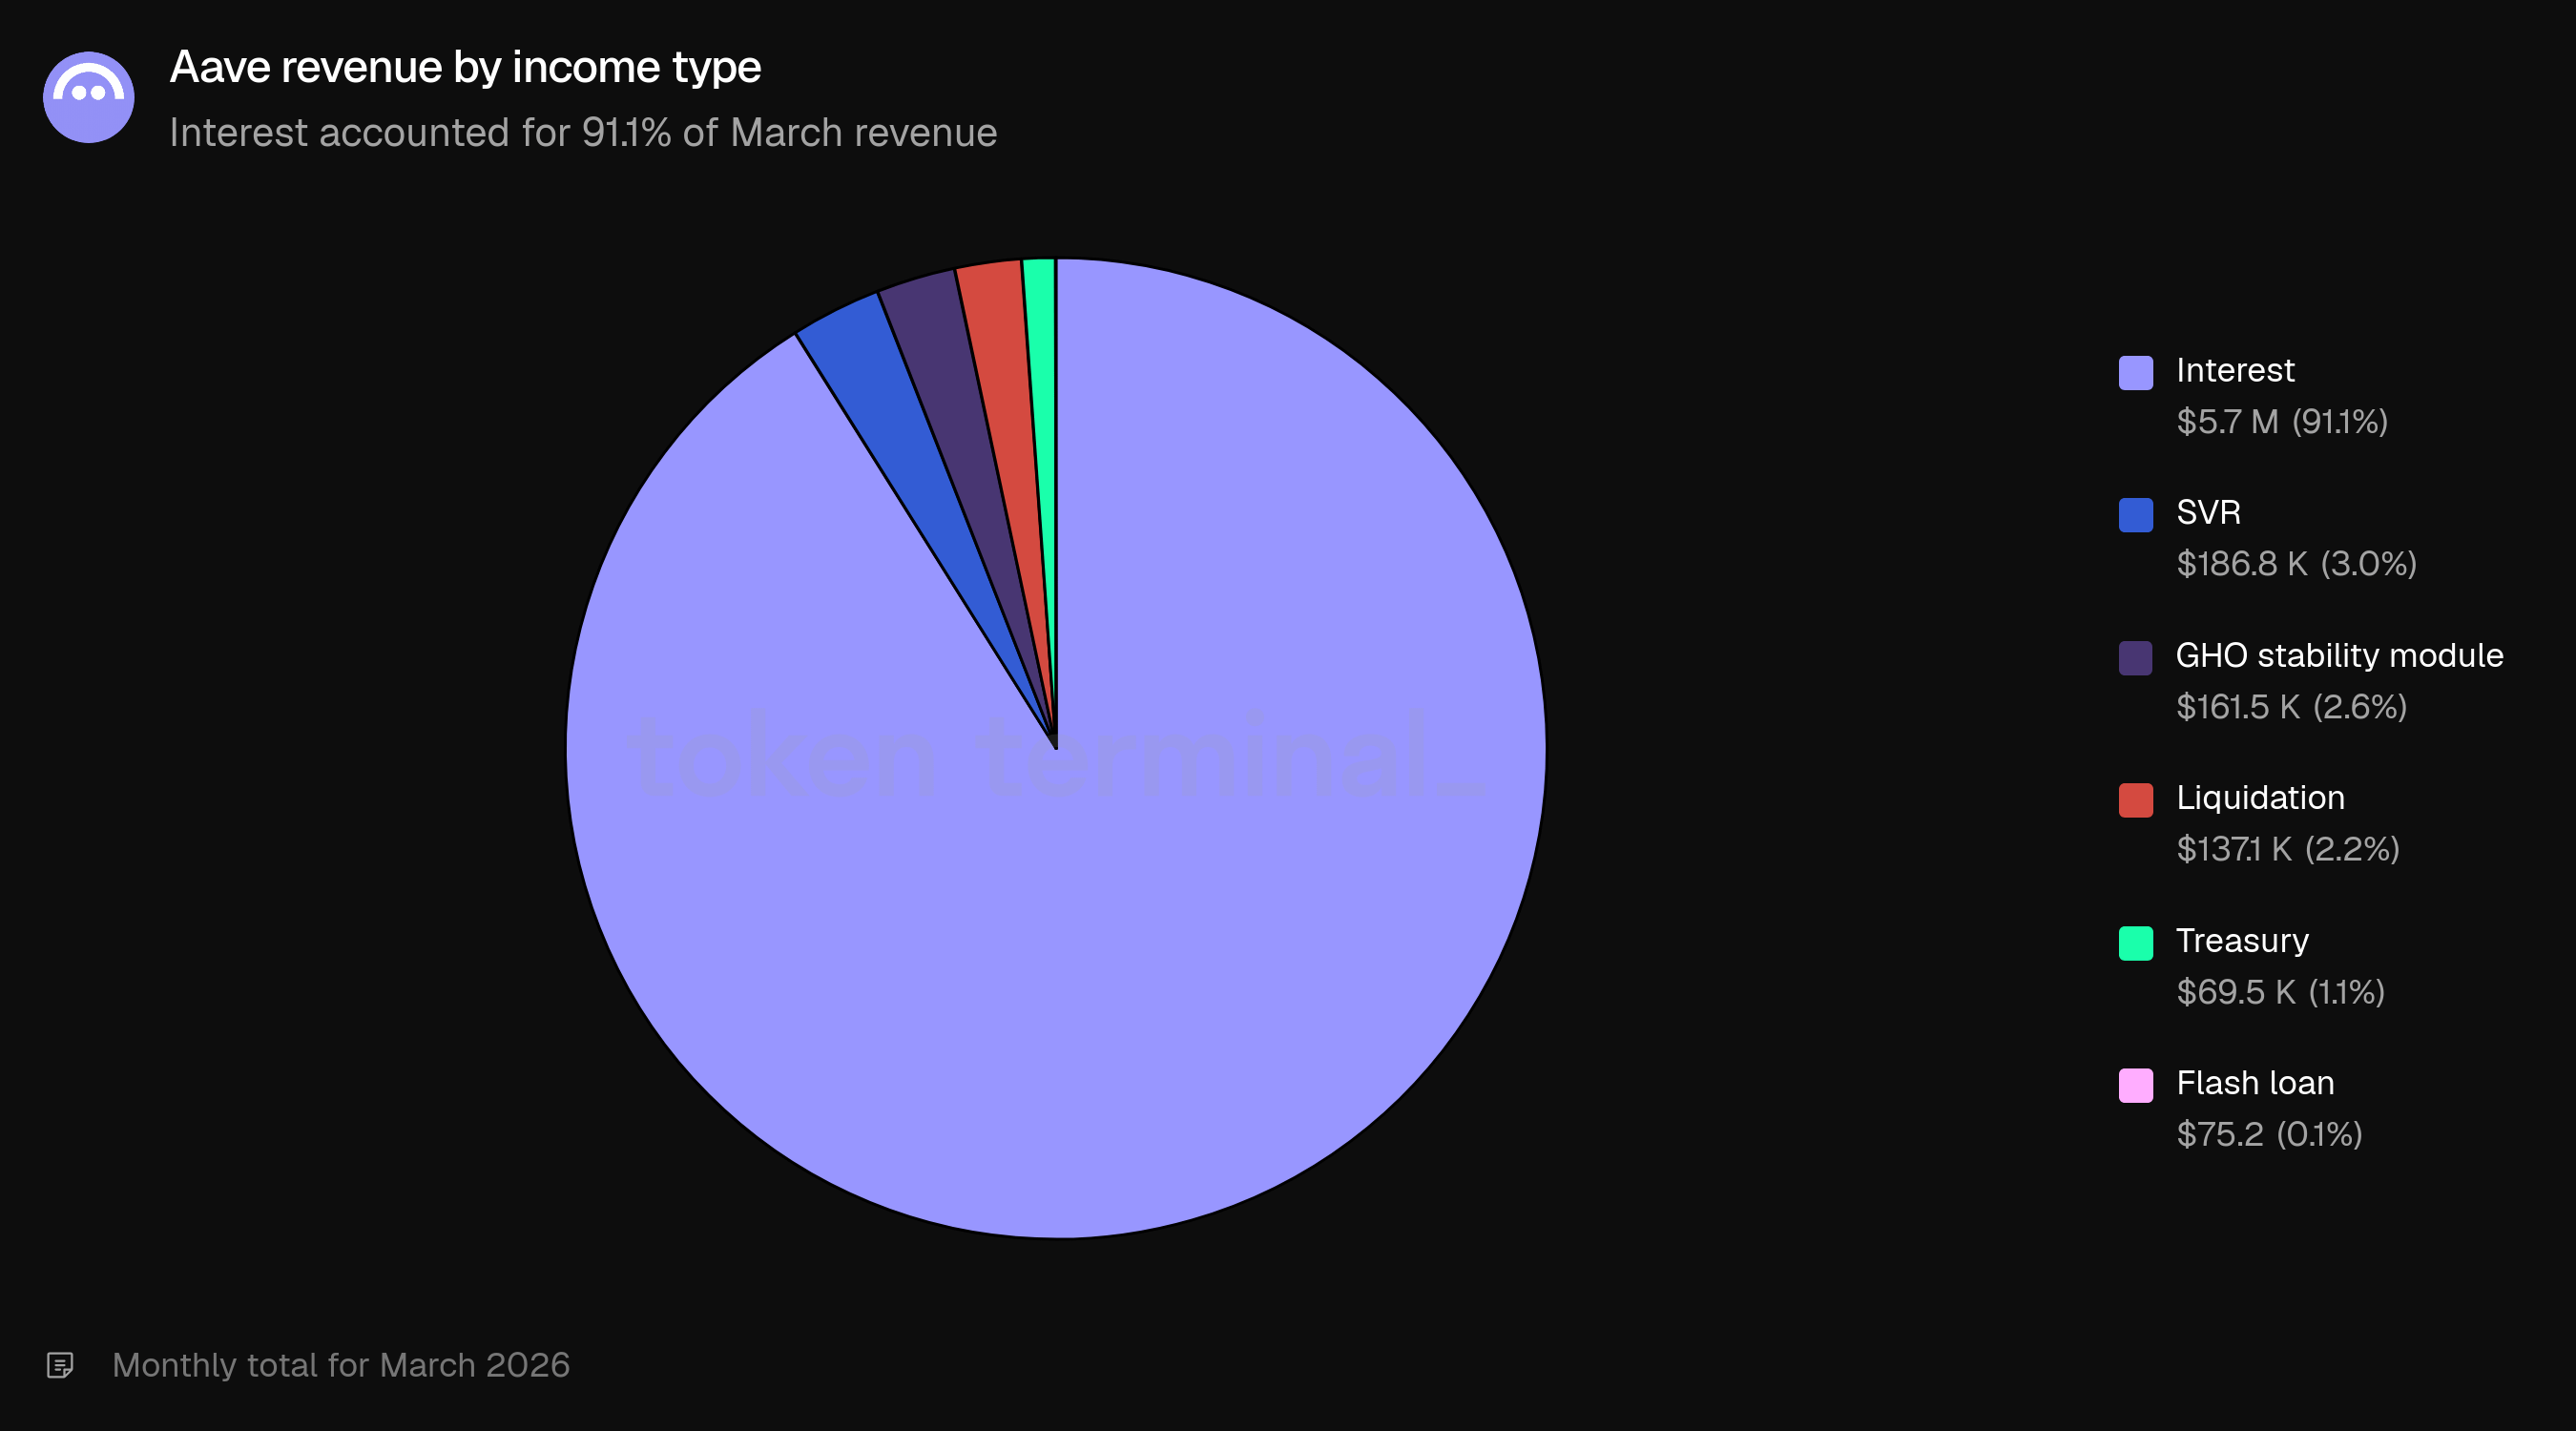
By income type, interest accounted for 91.1% of March revenue ($5.7m), followed by SVR at 3.0% ($186.8k), GHO stability module at 2.6% ($161.5k), liquidation at 2.2% ($137.1k), treasury at 1.1% ($69.5k), and flash loan at 0.1% ($75.2). The income composition returned to a profile dominated by interest income, in contrast to February where nearly half of revenue came from liquidation-related sources.
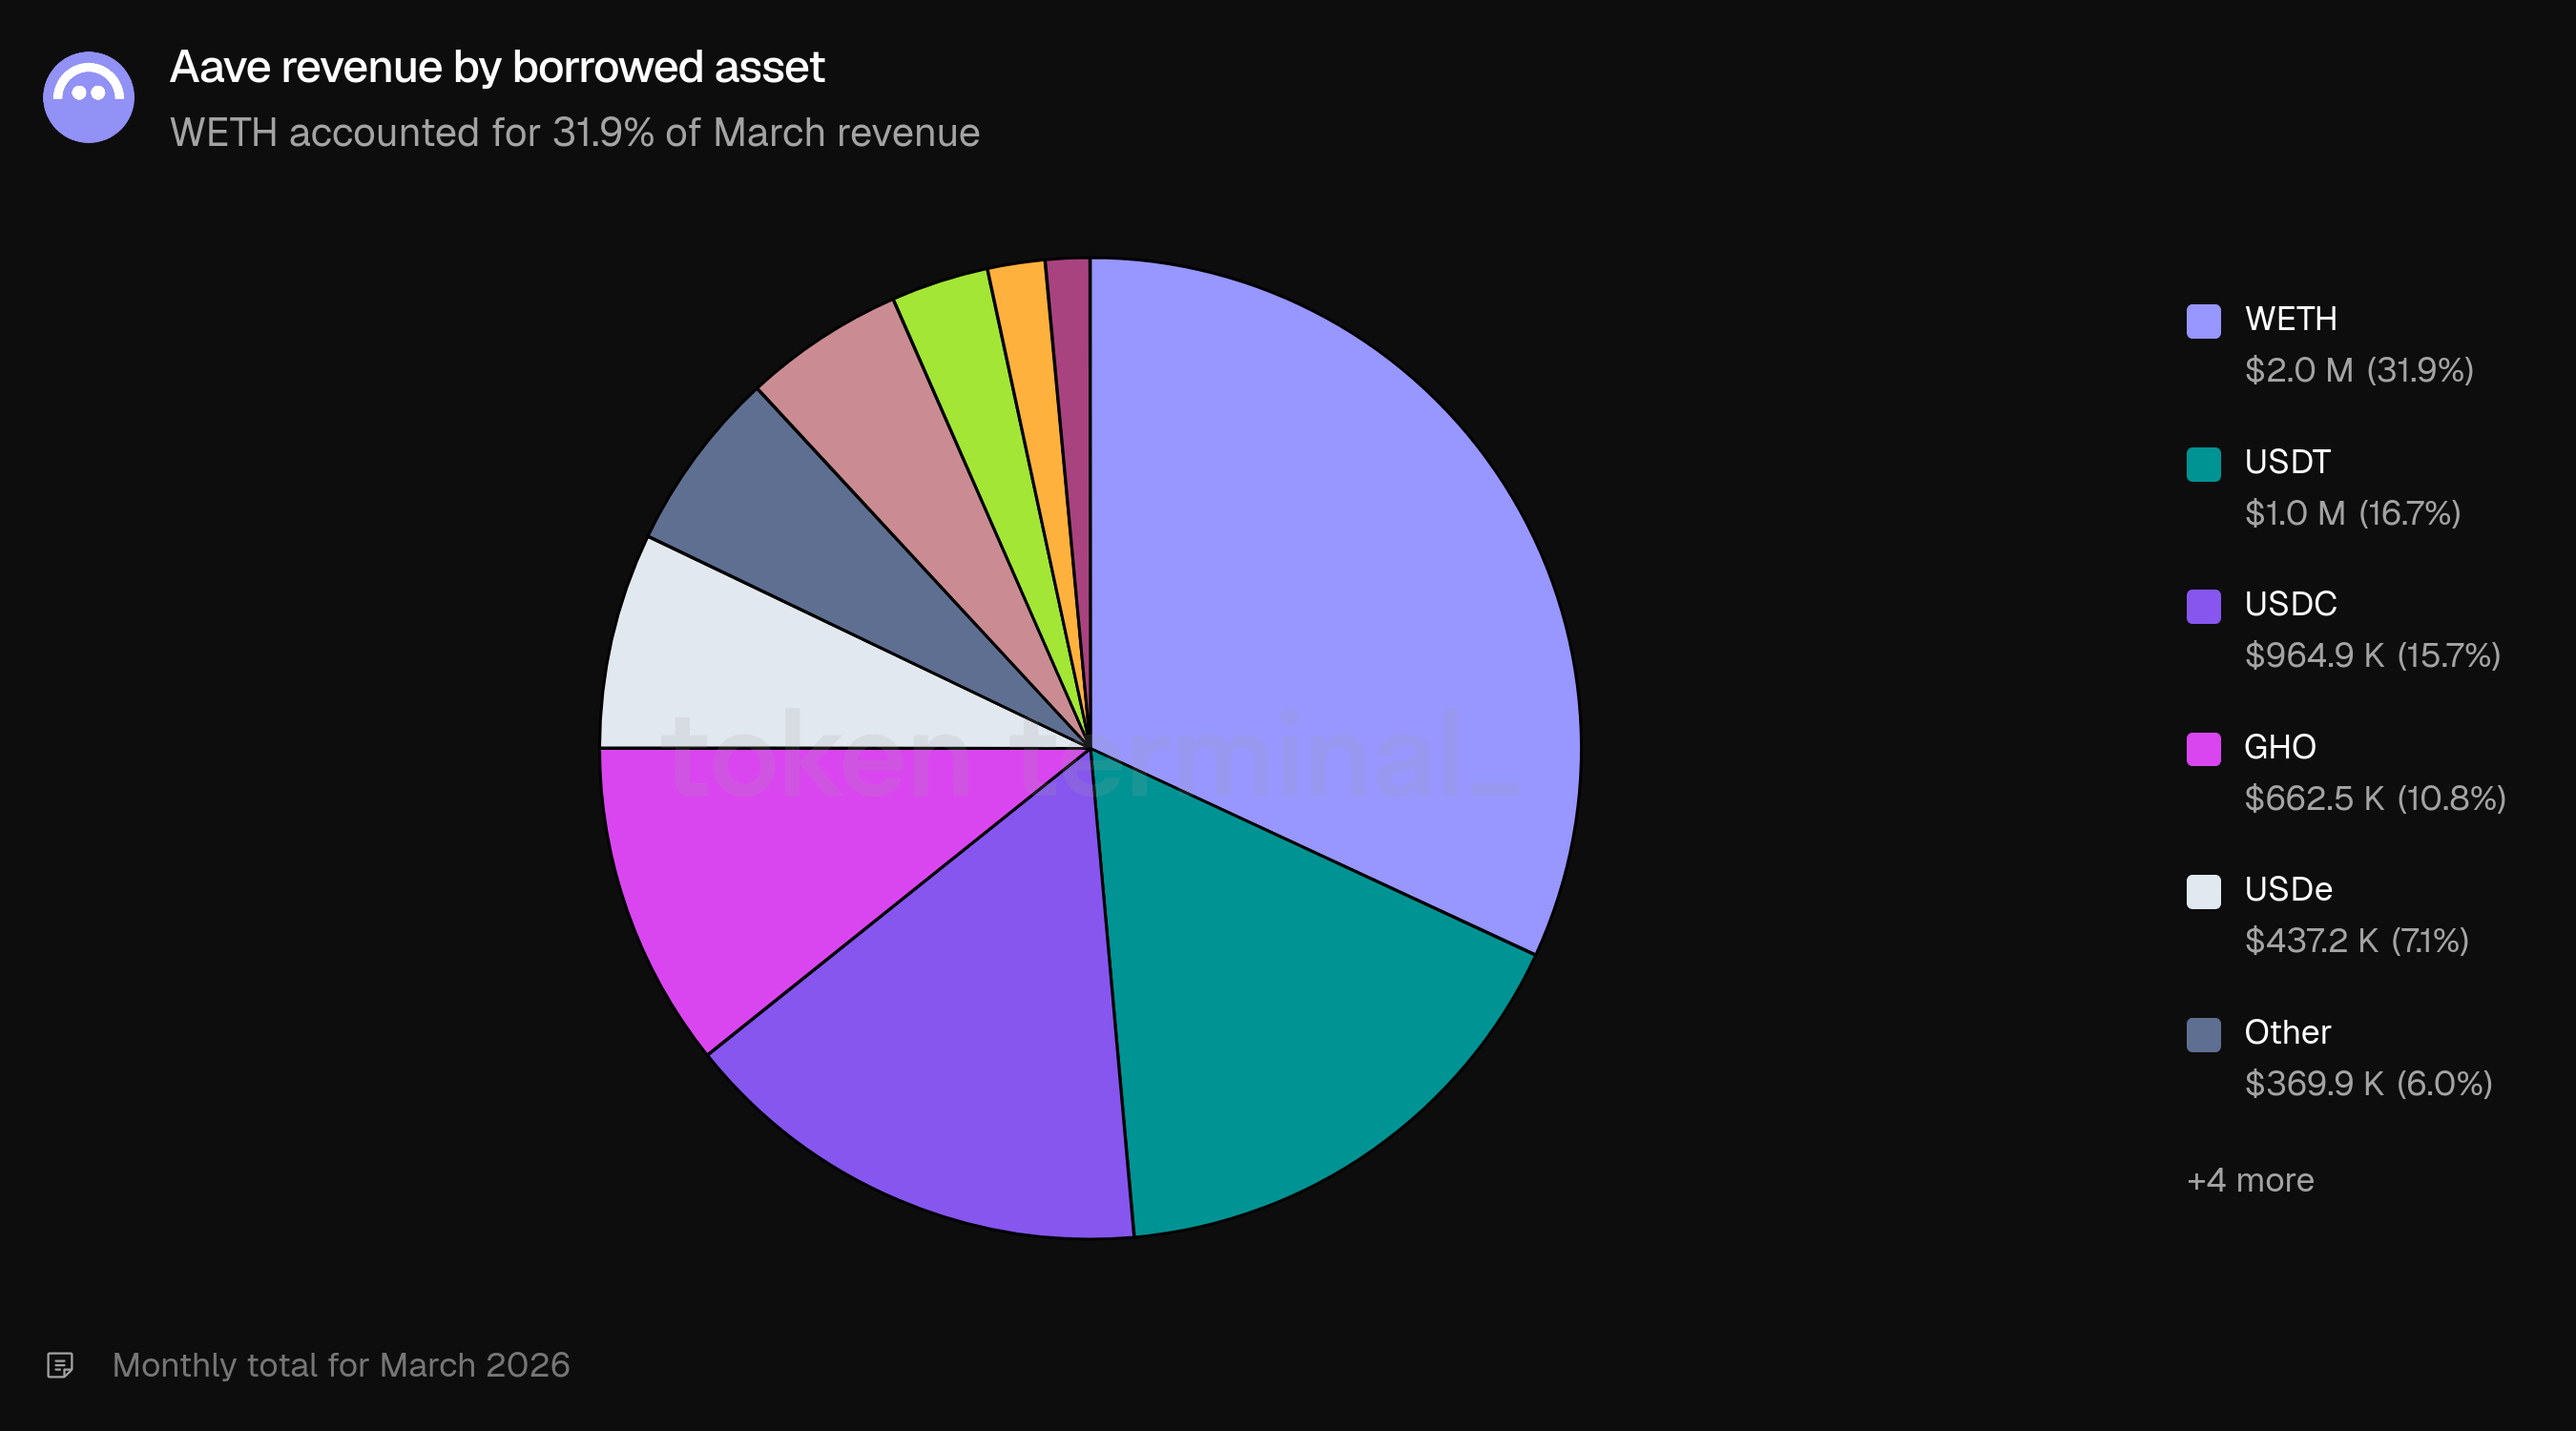
By borrowed asset, WETH accounted for 31.9% of revenue ($2.0m), followed by USDT (16.7%, $1.0m), USDC (15.7%, $964.9k), GHO (10.8%, $662.5k), and USDe (7.1%, $437.2k). GHO's 10.8% share of revenue is notable given its smaller role in the overall lending market, reflecting GHO role as Aave's native stablecoin.
6) Monthly active users
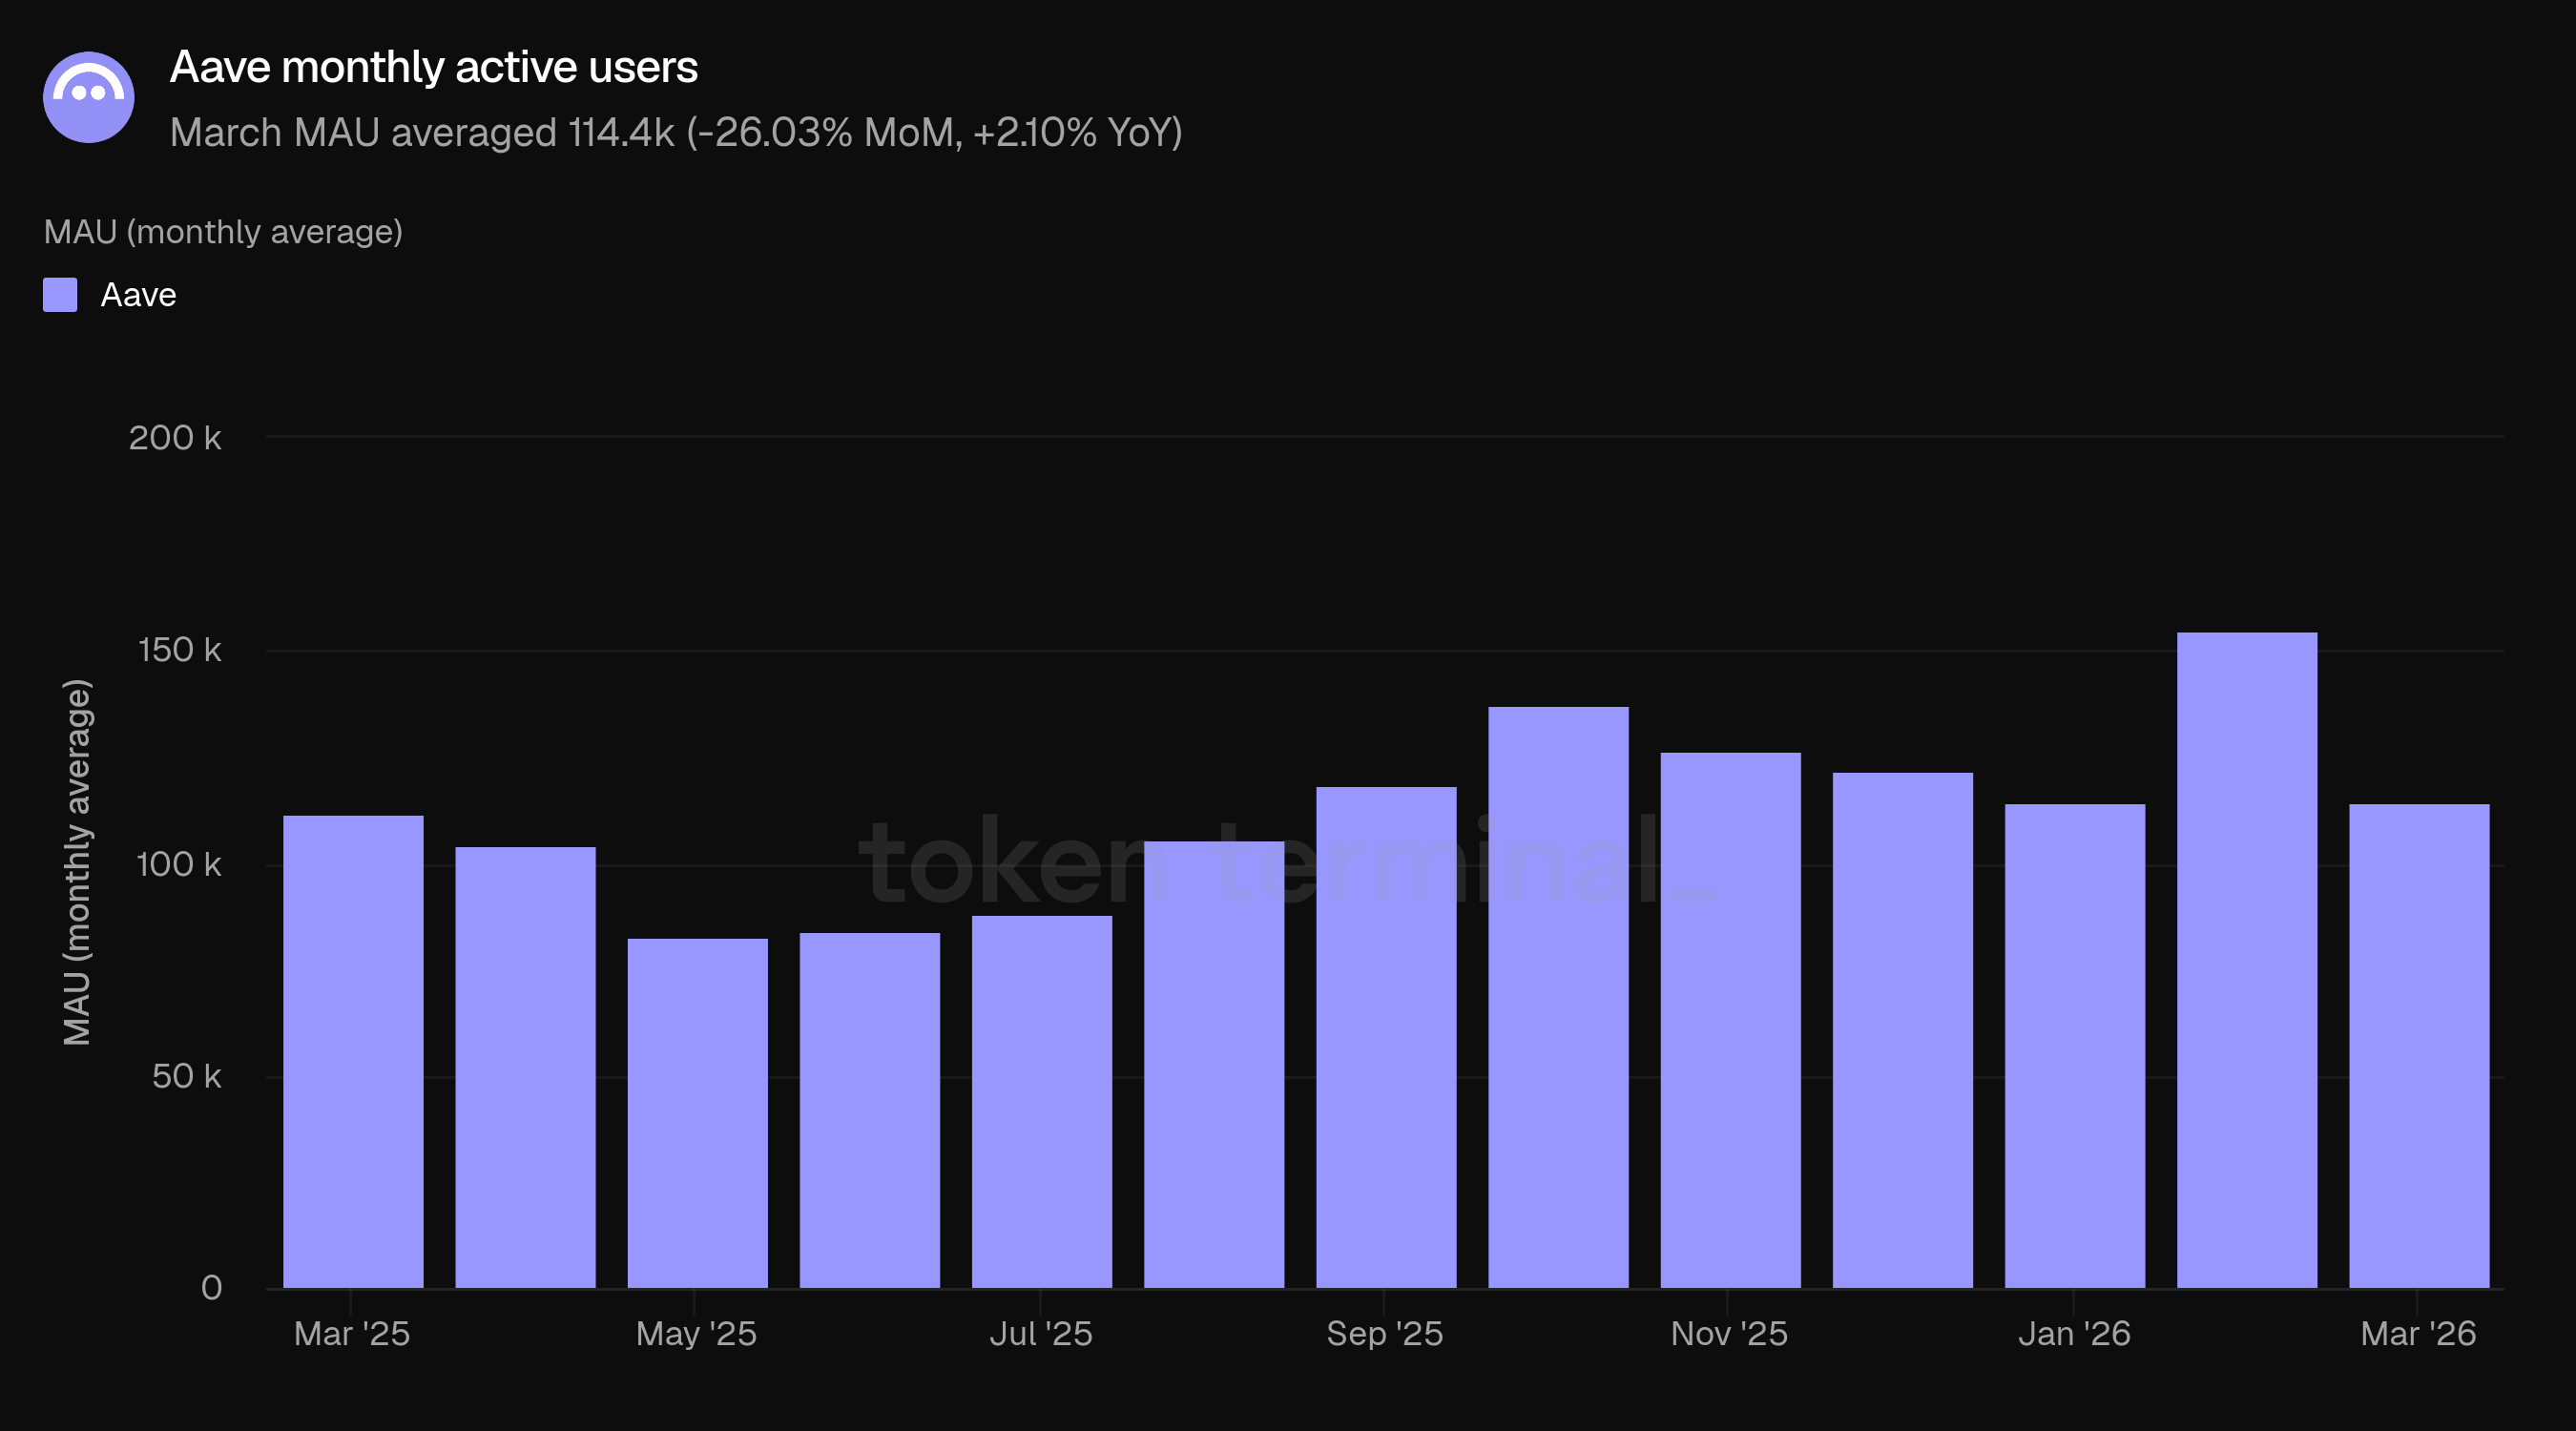
Monthly active users (MAU) measures the number of unique wallet addresses that have interacted with Aave over a rolling 30-day period. March MAU averaged 114.4k, down 26.03% from February's 154.6k but up 2.10% from March 2025's 112.0k.
February's elevated MAU coincided with the market correction, which typically draws increased onchain activity from users. March's 114.4k is broadly in line with year-ago levels (112.0k). The year-over-year comparison (+2.10%) indicates a stable user base, consistent with a market that is significantly larger in capital terms (+45.45% TVL YoY) but not proportionally larger in unique participants.
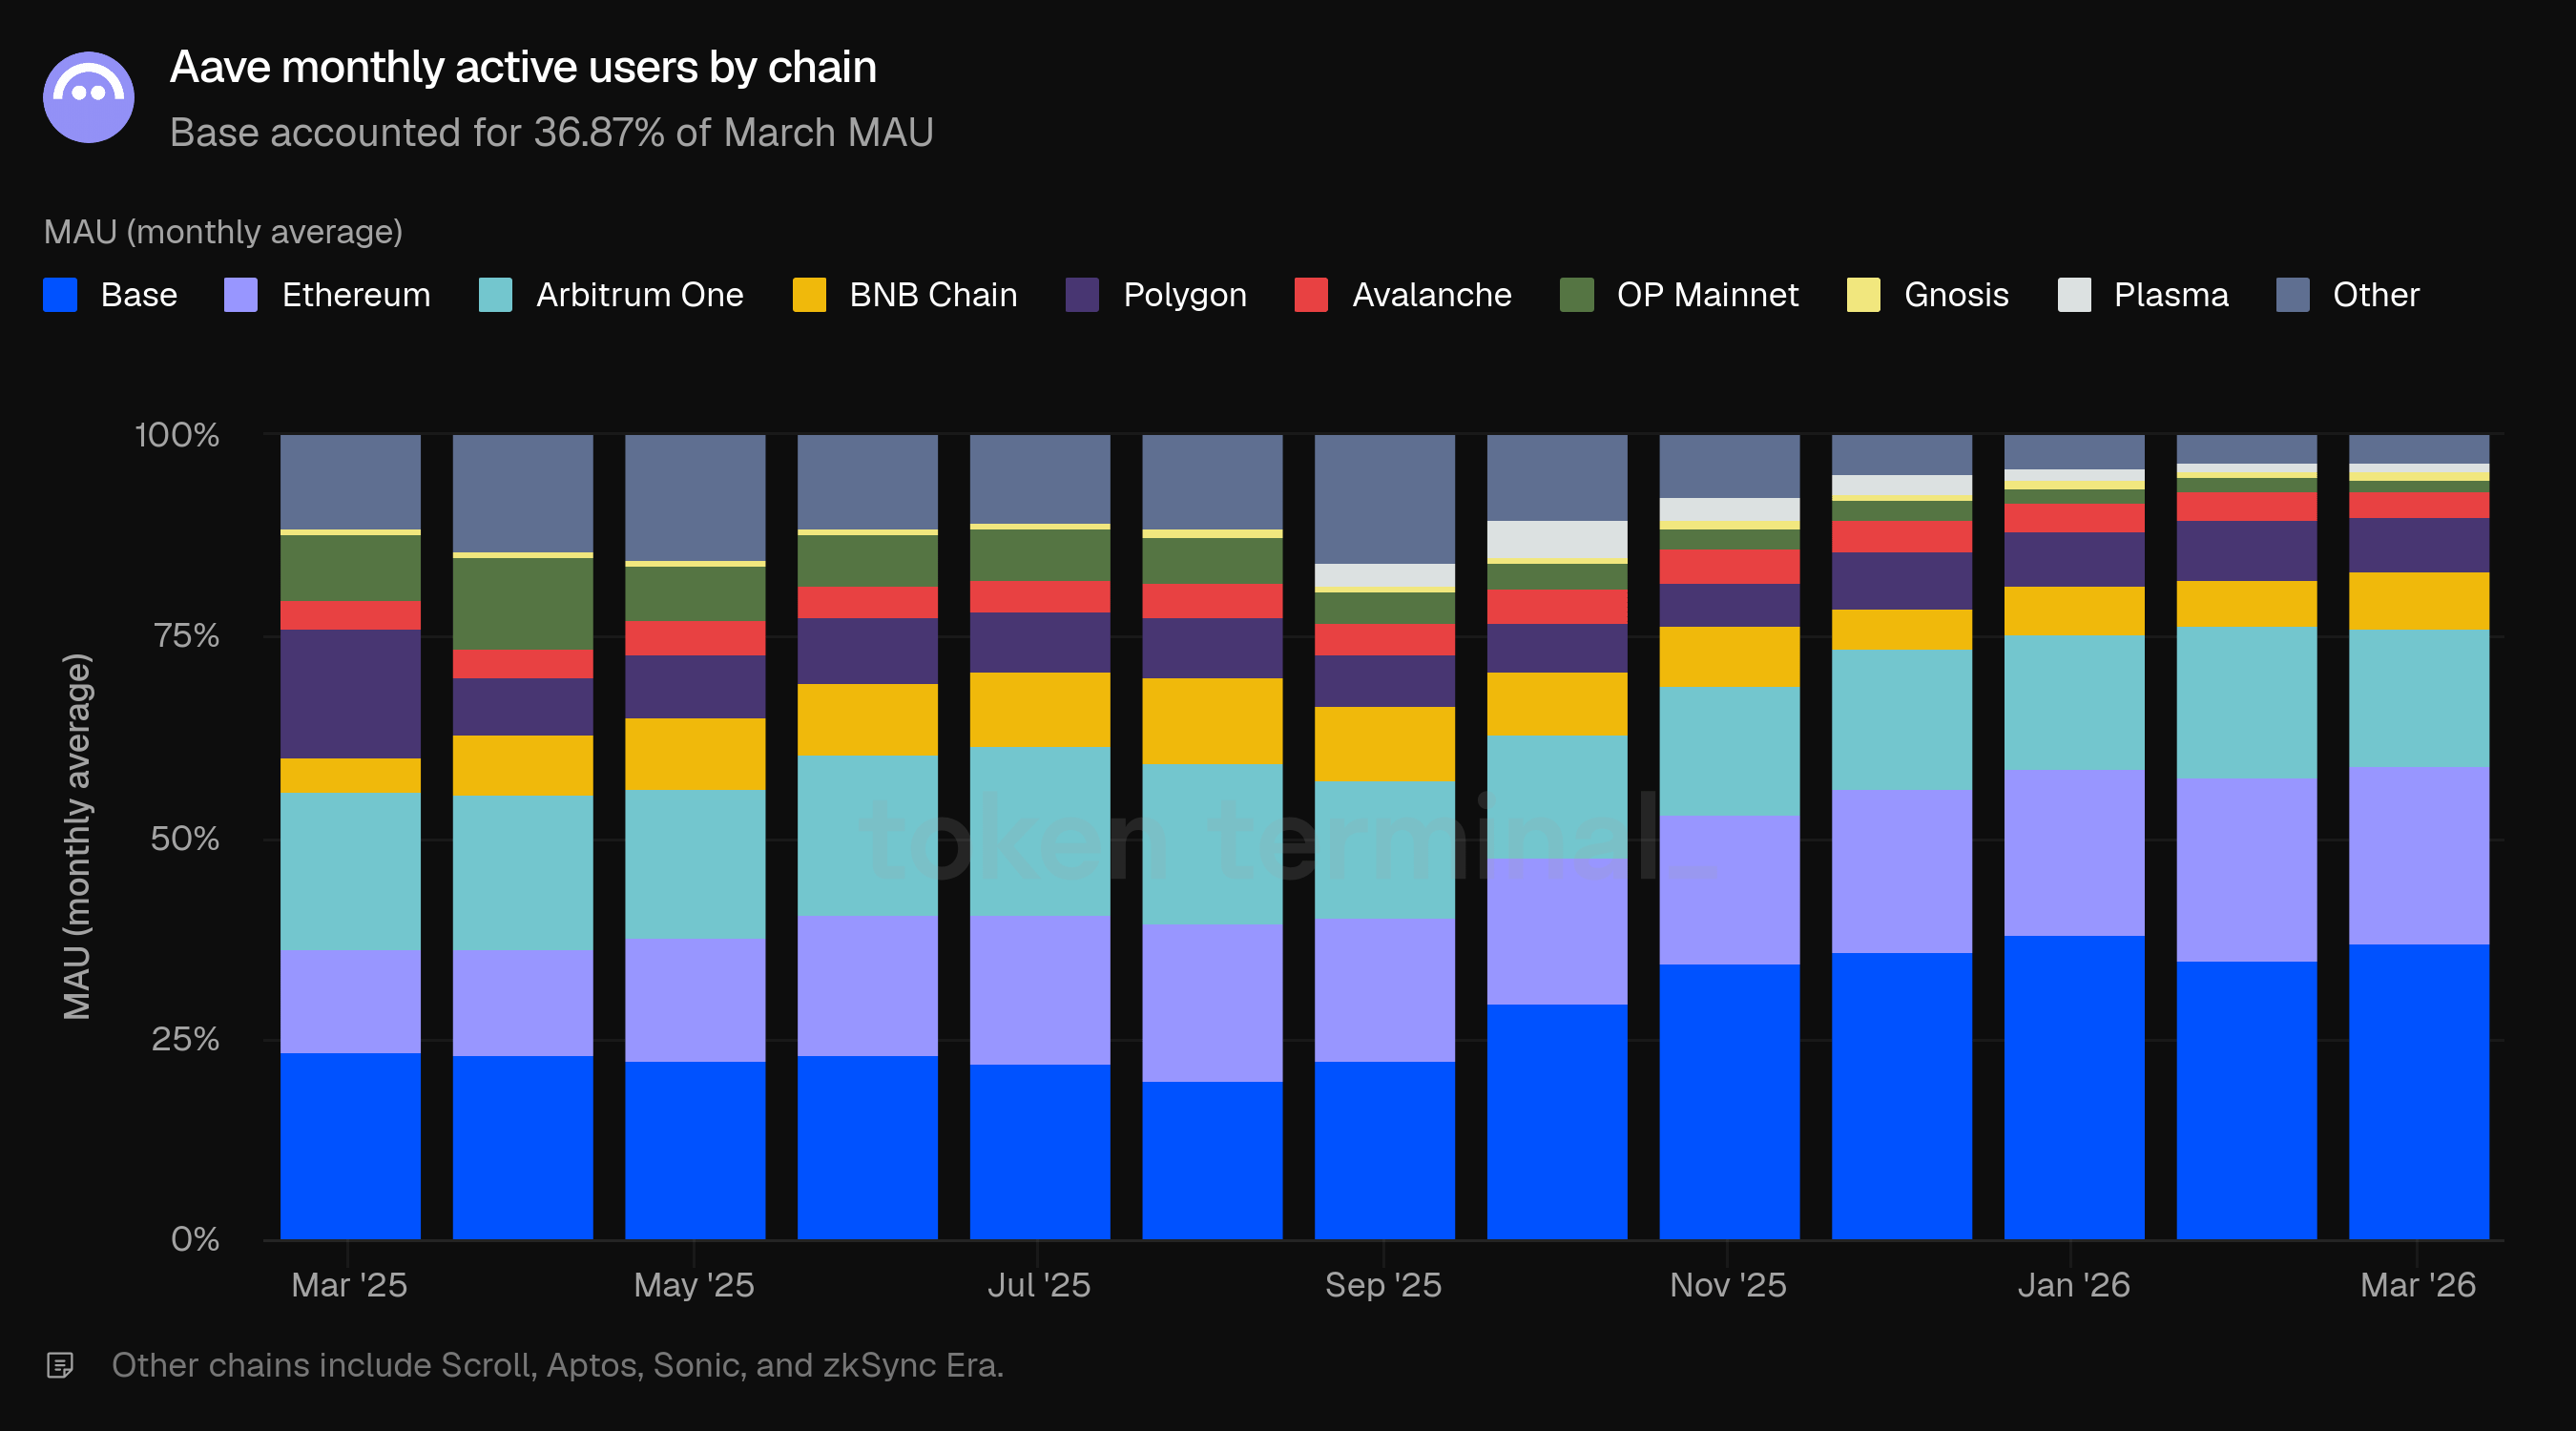
User activity continued to skew heavily toward multichain deployments. Base led at 36.87% of MAU, up from 34.80% in February and 23.48% a year ago. Ethereum was second at 22.31%, followed by Arbitrum One (17.13%), Polygon (7.09%), BNB Chain (6.80%), Avalanche (3.04%), OP Mainnet (1.57%), Gnosis (1.11%), and Plasma (1.05%).
The divergence between capital distribution and user distribution remained stark: Ethereum held 82.06% of TVL but only 22.31% of MAU, while Base held 2.94% of TVL but 36.87% of MAU. Ethereum generates disproportionate economic value per user, while multichain deployments account for the majority of unique addresses.
7) Market share
Market share measures Aave's share of active loans relative to other lending projects, including Morpho, Fluid, Kamino, Spark, Maple Finance, Silo Finance, Euler, and Compound. Aave averaged 59.79% market share in March, down 2.95 pp from February and up 0.63 pp from March 2025.
The total addressable market contracted slightly, from $28.36b to $27.68b, as deleveraging continued across the lending sector.
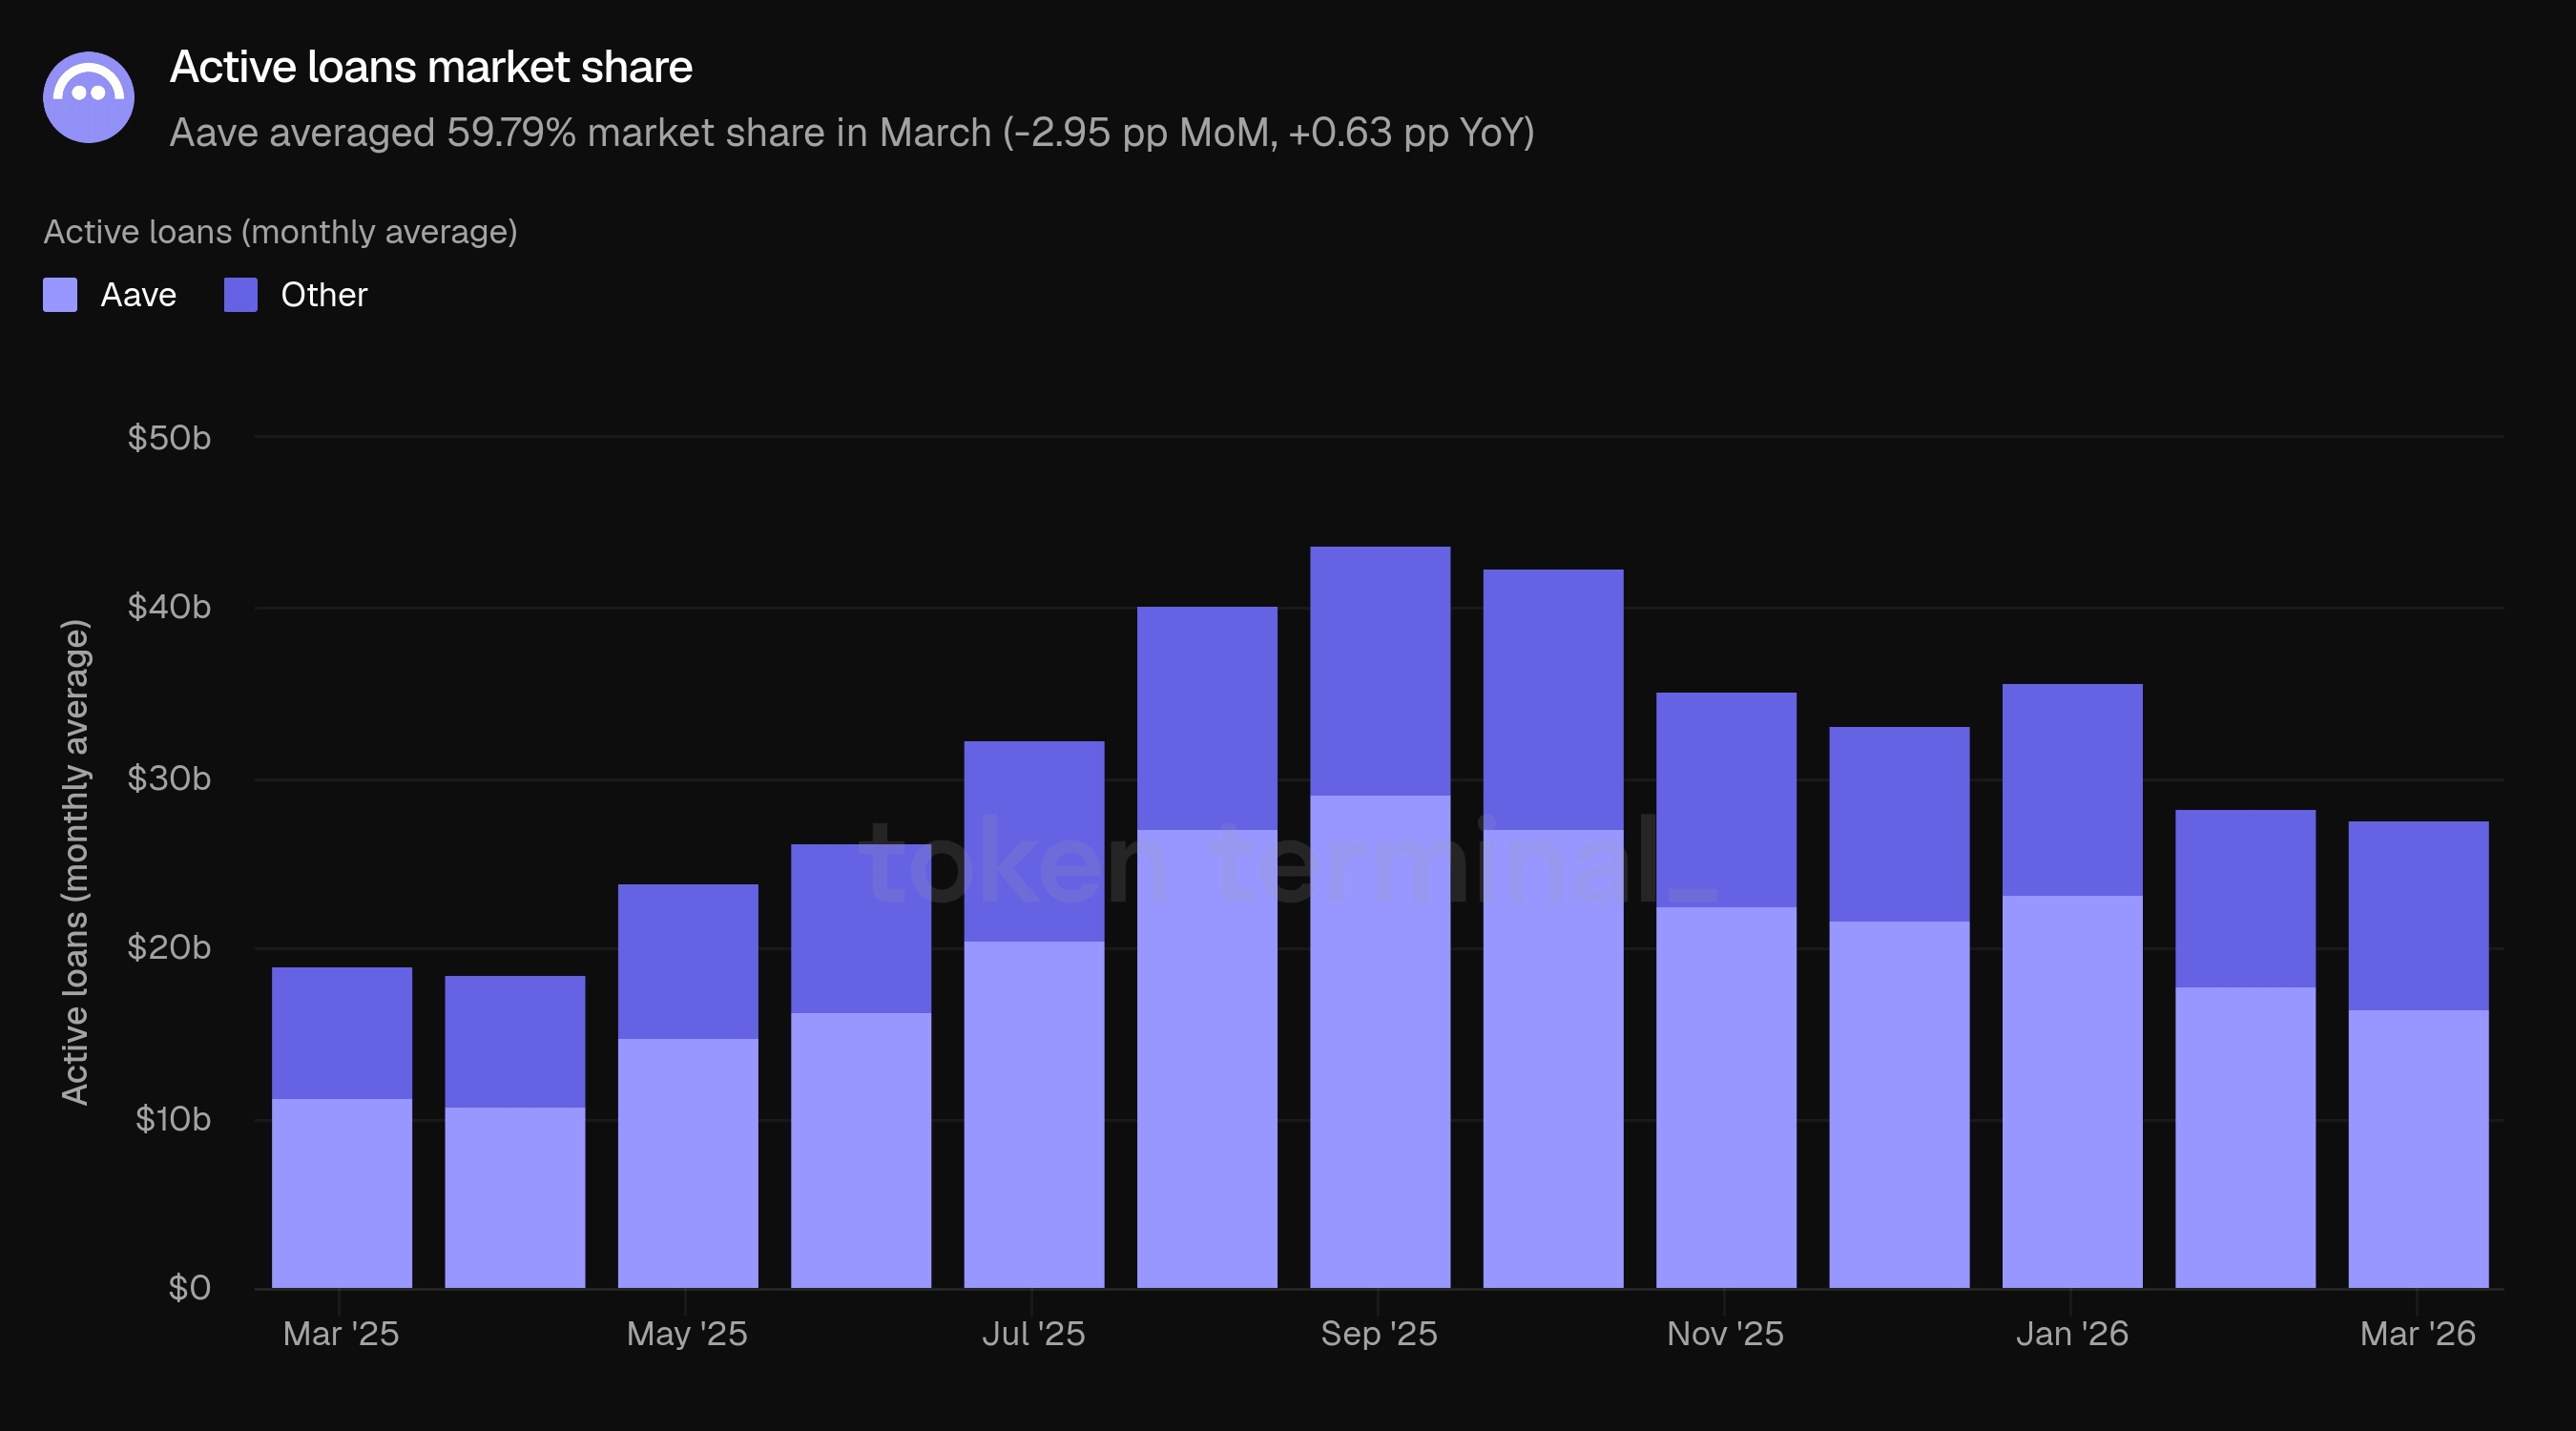
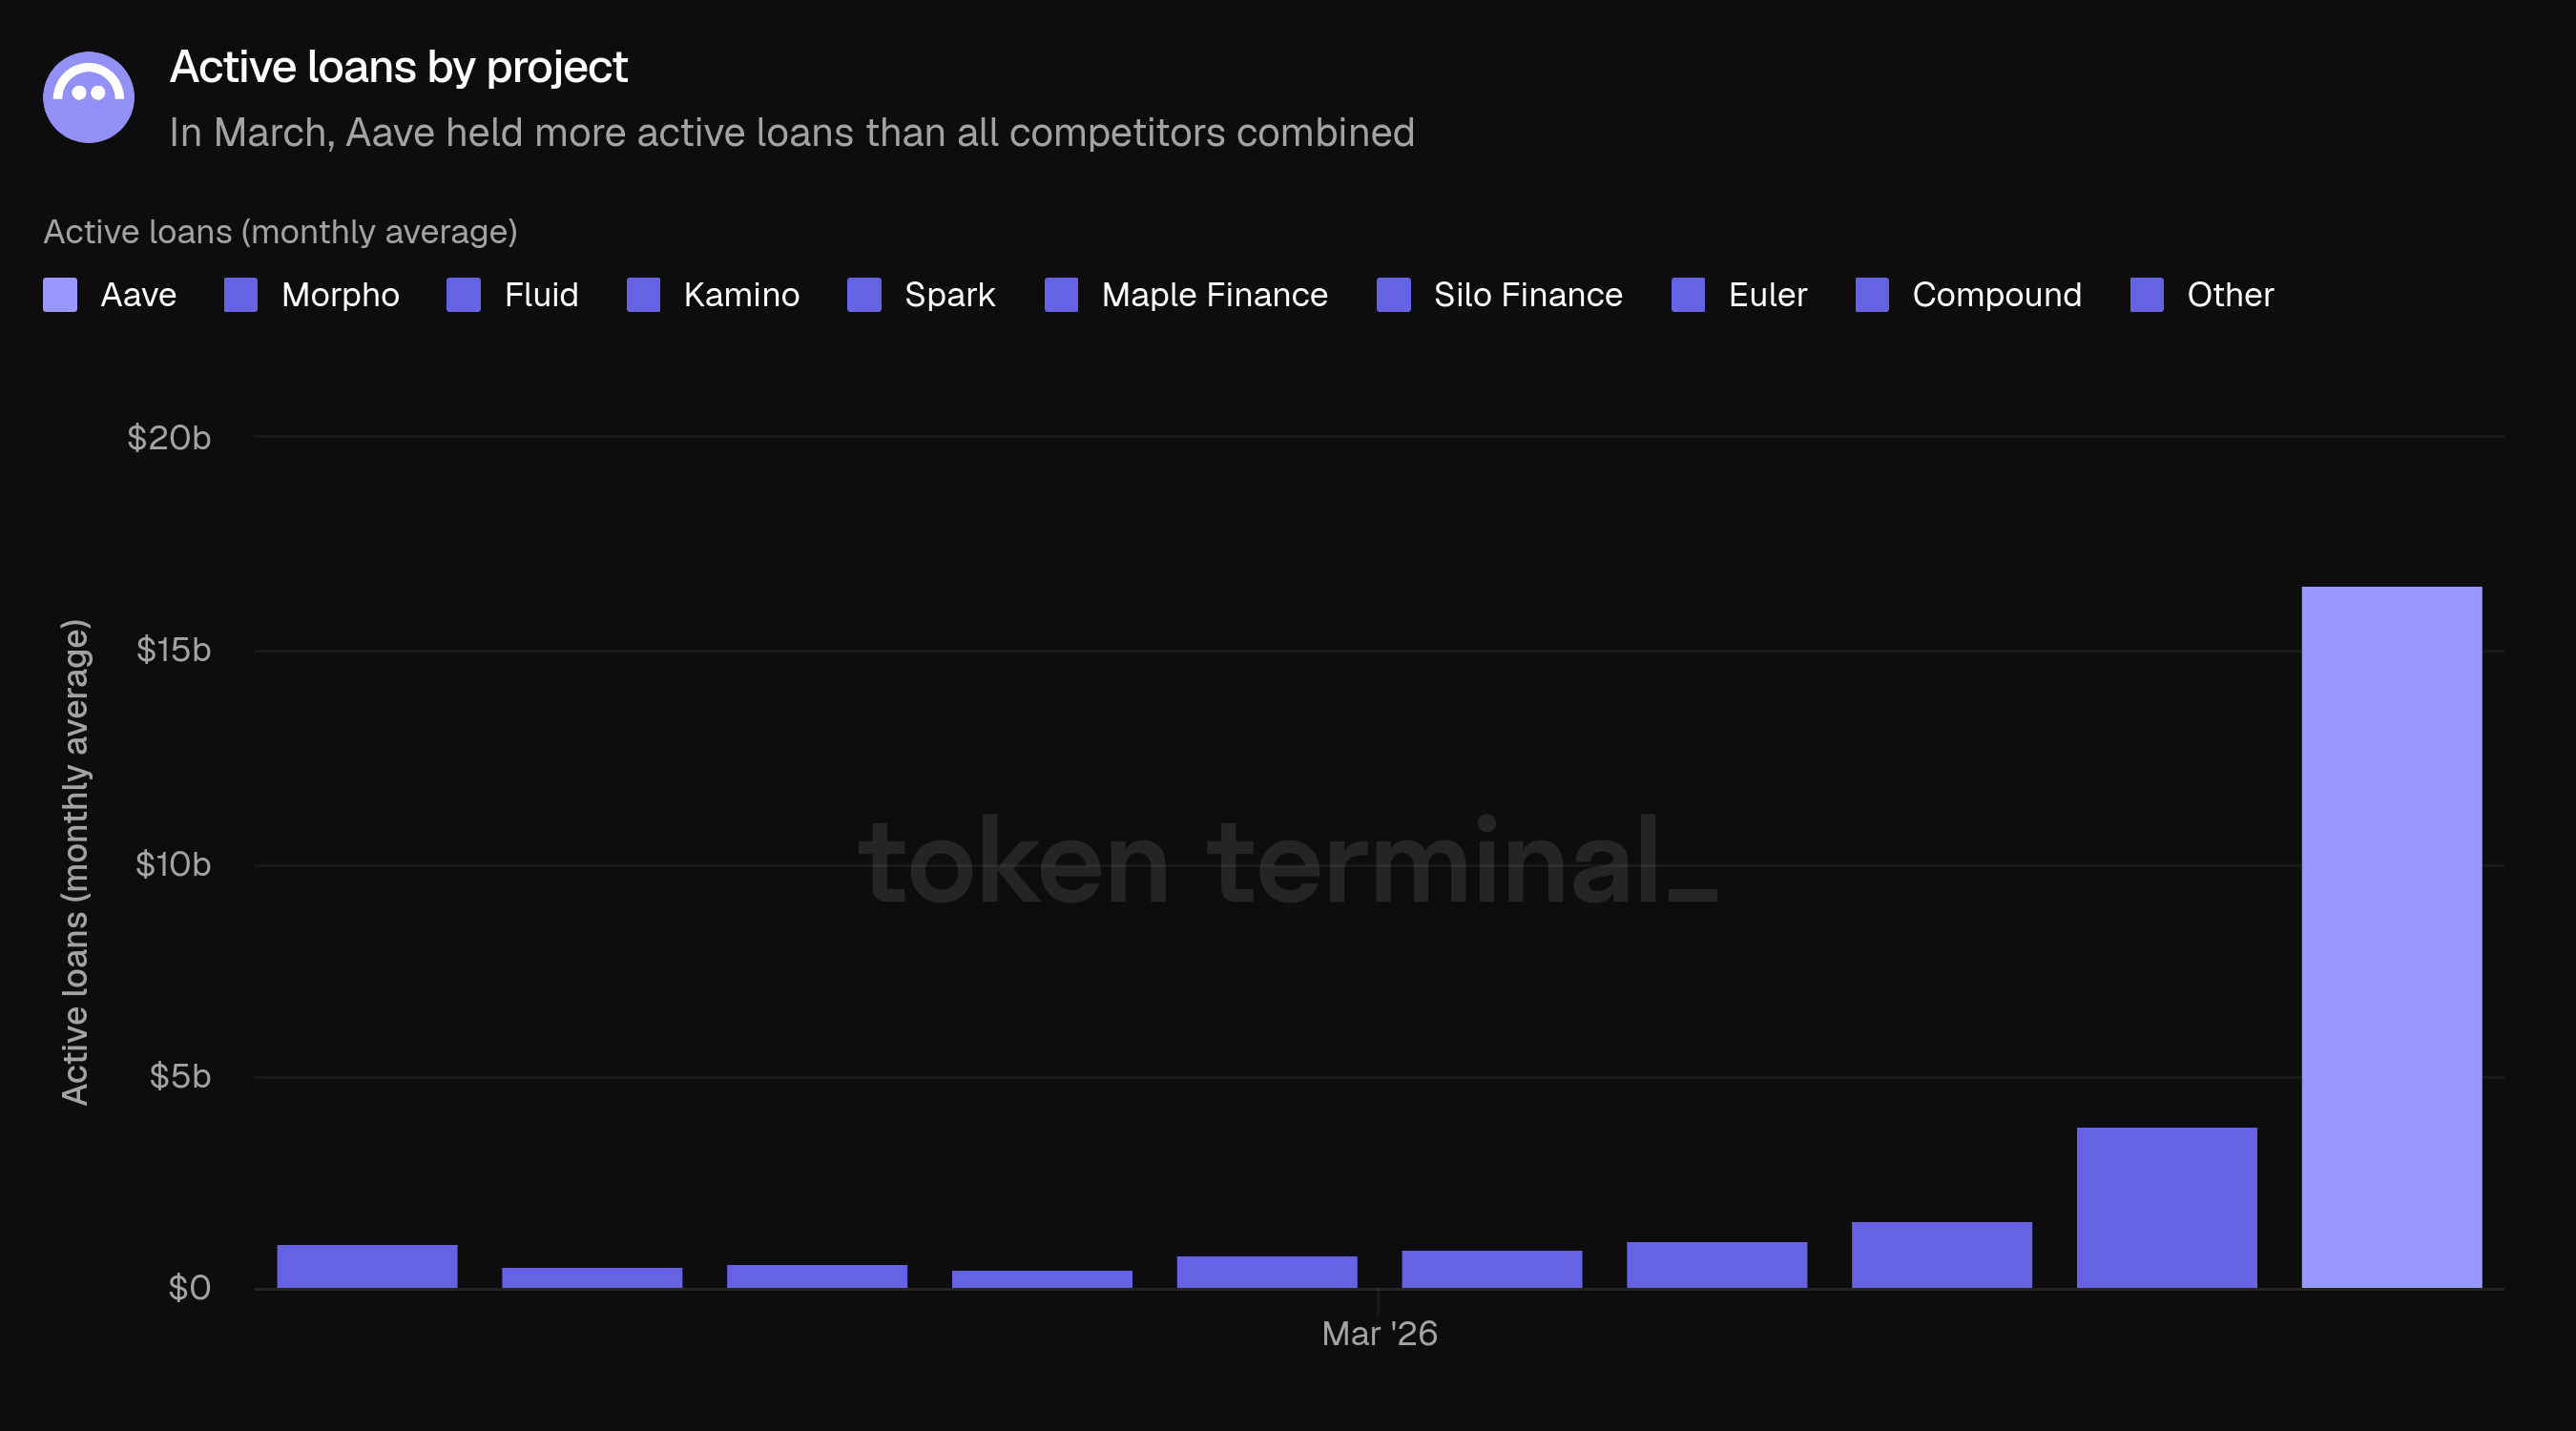
With $16.55b in active loans out of a $27.68b total market, Aave held more active loans than all other tracked competitors combined. The nearest competitor was Morpho at $3.83b (13.8%), followed by Fluid ($1.62b, 5.9%), Kamino ($1.17b, 4.2%), Spark ($973.4m, 3.5%), Maple Finance ($817.4m, 3.0%), Euler ($637.0m, 2.3%), Compound ($547.9m, 2.0%), and Silo Finance ($462.6m, 1.7%).
8) GHO market cap & transfer volume
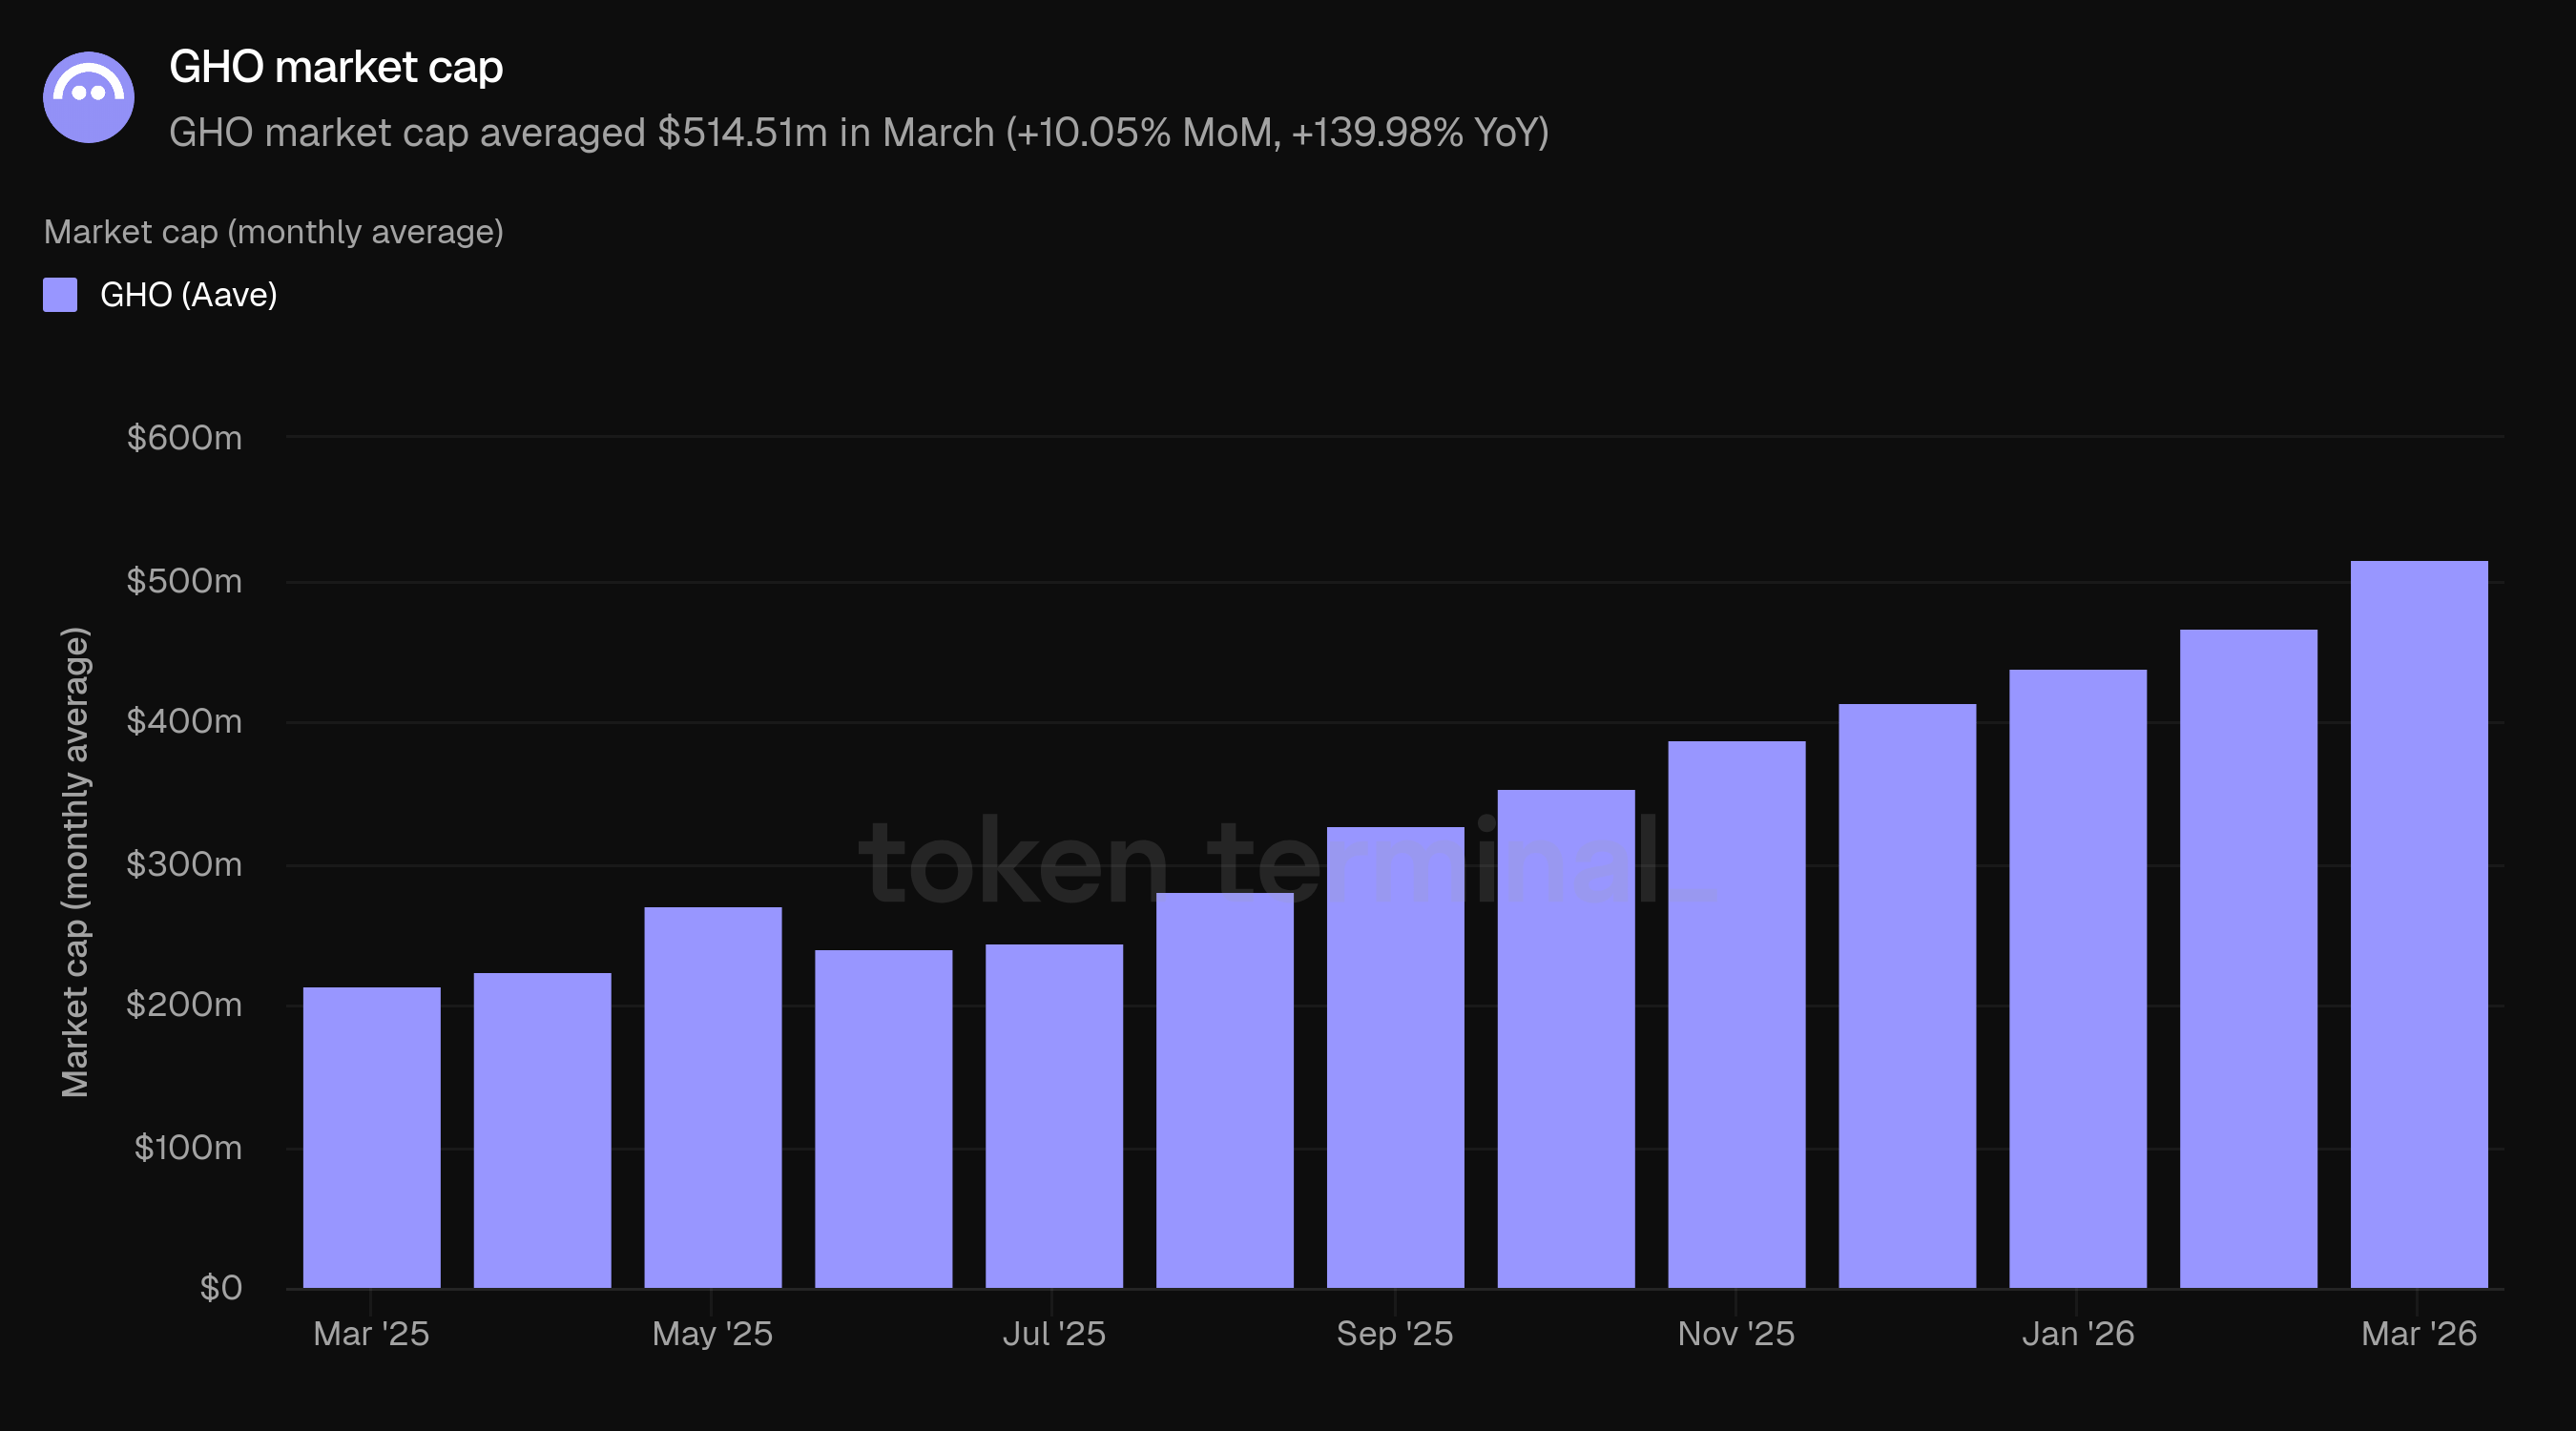
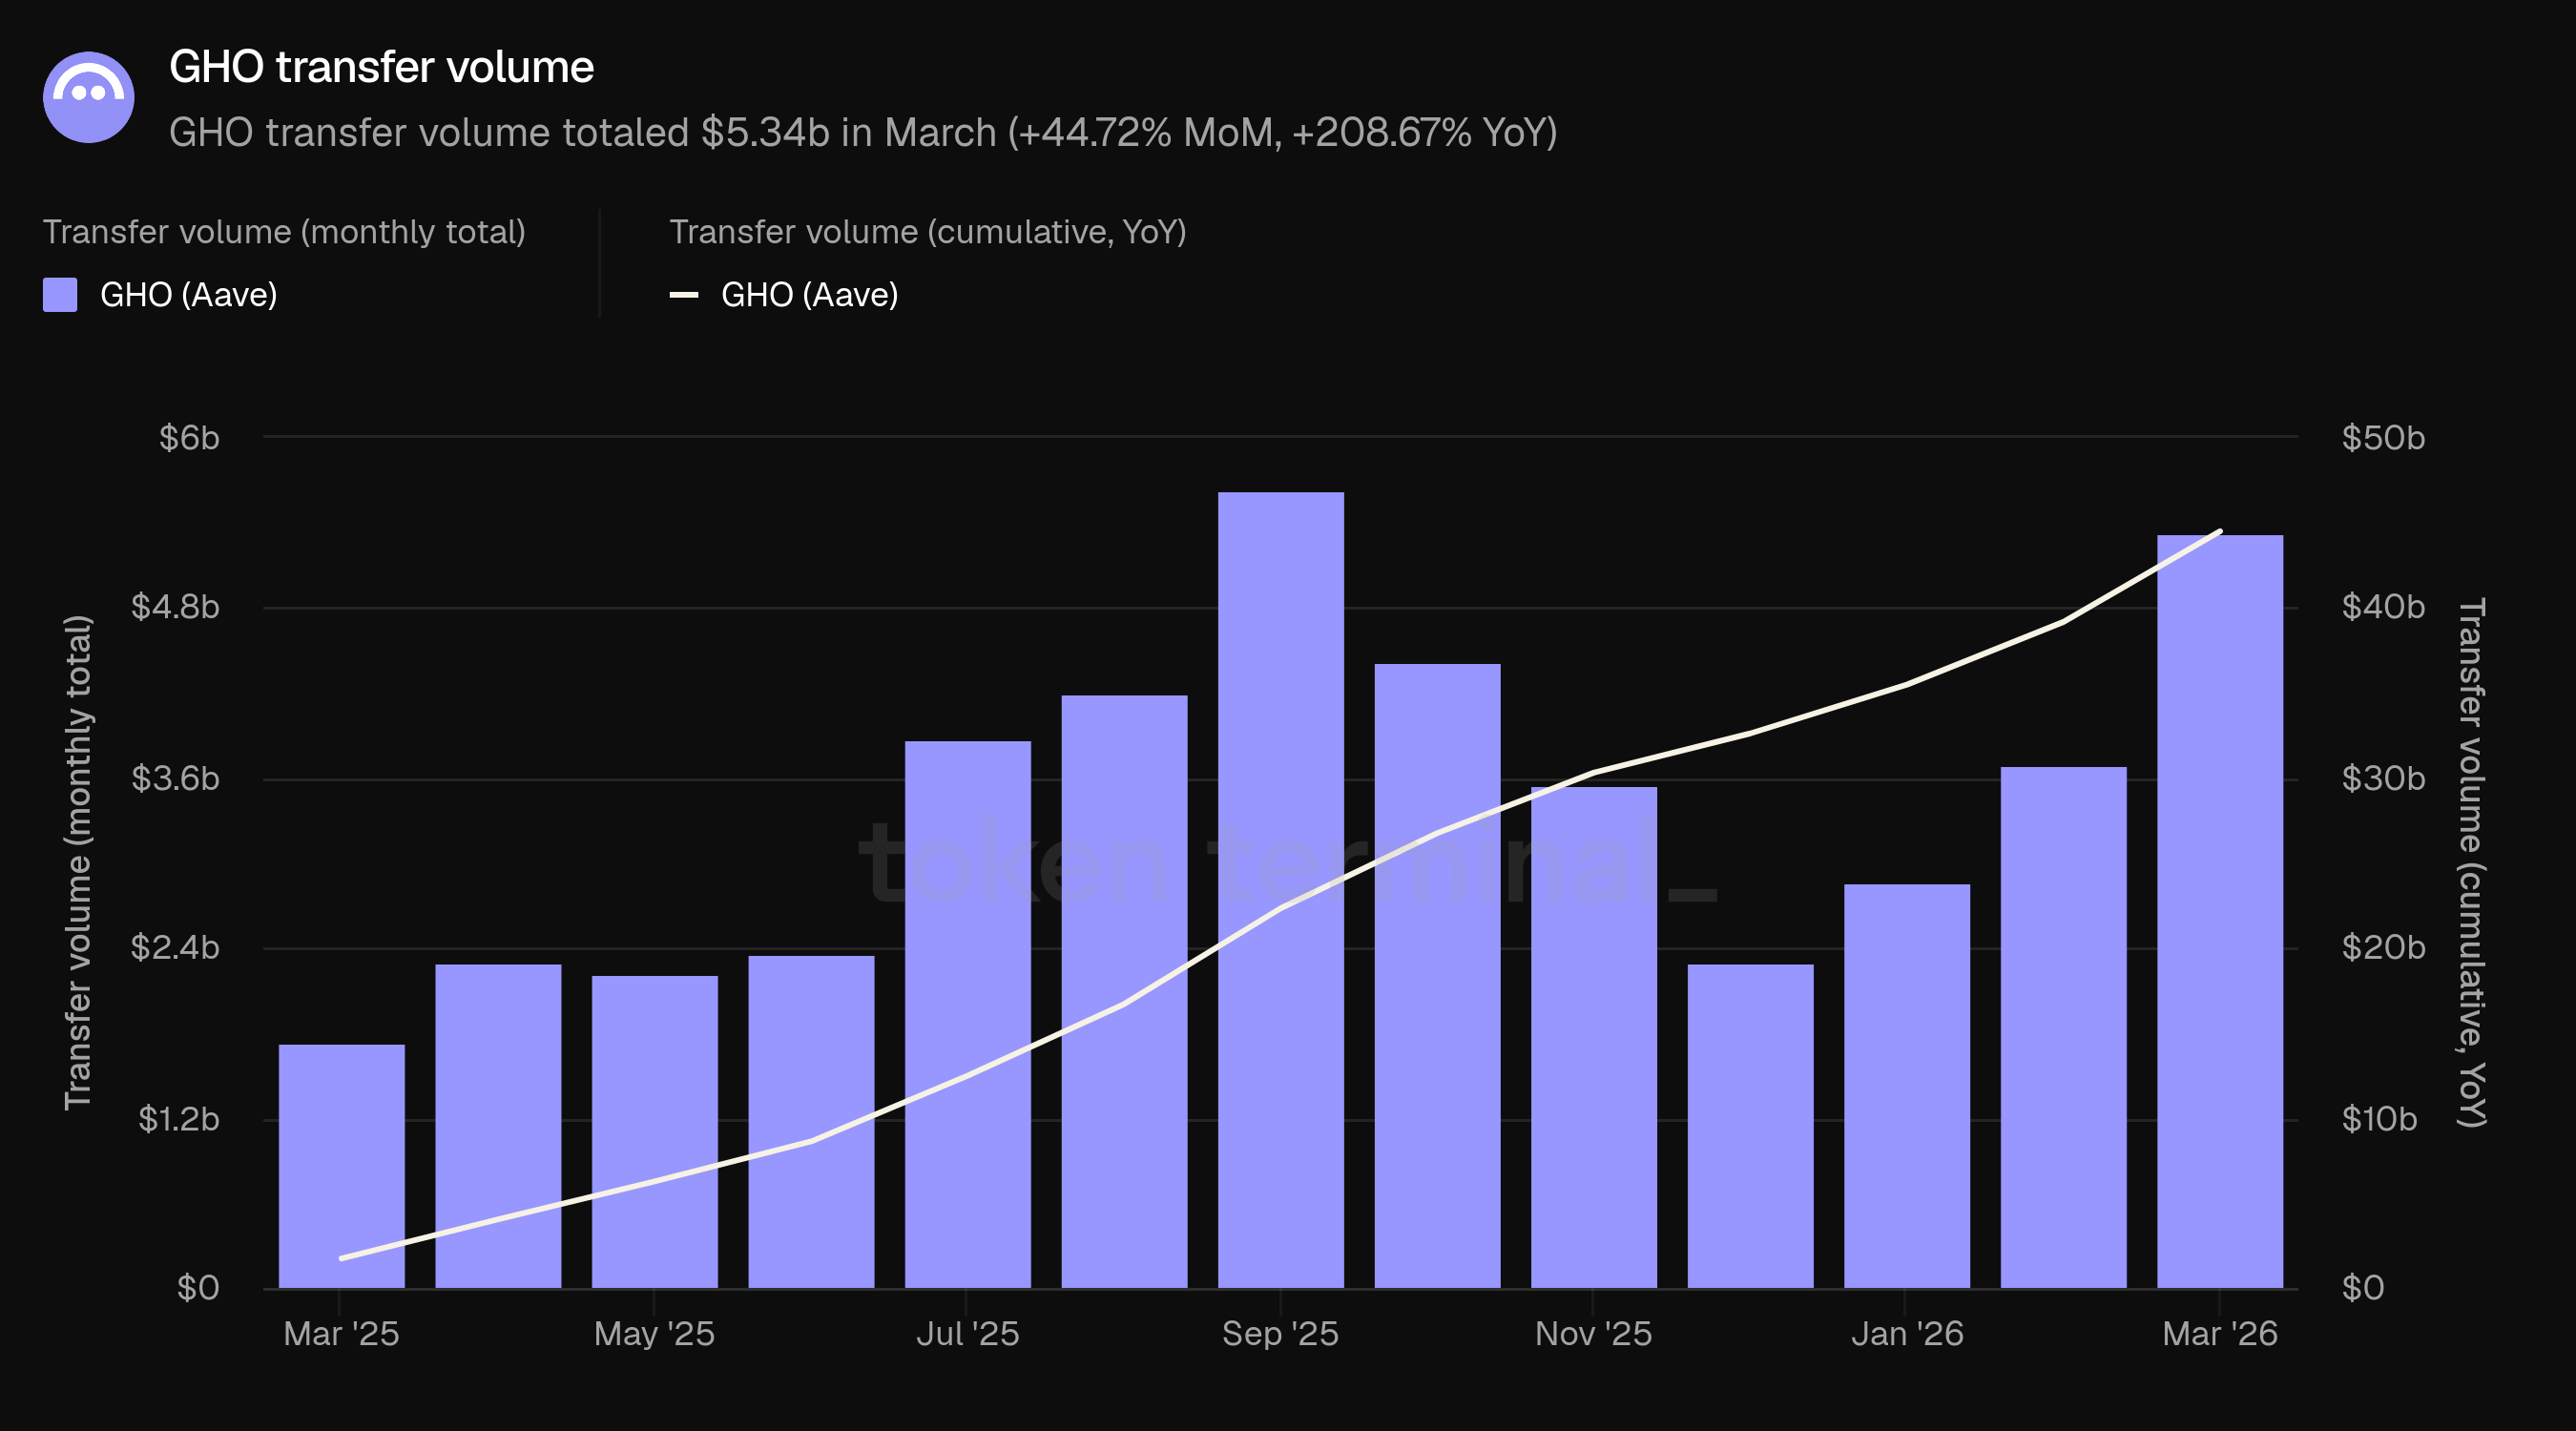
GHO market cap measures the circulating market capitalization of GHO, Aave's native decentralized stablecoin. GHO is minted by borrowers using their Aave collateral, so its market cap reflects both stablecoin demand and adoption of Aave's lending markets. March GHO market cap averaged $514.51m, up 10.05% from February's $467.53m and up 139.98% from March 2025's $214.40m. GHO crossed the $500m mark for the first time during March.
GHO grew in both February and March while TVL, active loans, fees, and revenue declined or normalized. GHO accounted for 10.65% of March revenue through the GHO stability module and interest on GHO-collateralized borrows, making it a meaningful and growing contributor to DAO income.
GHO transfer volume measures the total USD value of GHO transferred onchain over a given period. March transfer volume totaled $5.34b, up 44.72% from February's $3.69b and up 208.67% from March 2025's $1.73b. March was the second-highest month on record, approaching the September 2025 peak of $5.63b. Transfer volume declined through late 2025 alongside broader market activity but has rebounded sharply in Q1 2026, with March volume more than doubling year-over-year even as GHO's market cap grew at a slower pace. The divergence between transfer volume growth (+208.67% YoY) and market cap growth (+139.98% YoY) indicates increasing velocity: each unit of GHO is being transacted more frequently.
9) Aave Horizon
Aave Horizon is a permissioned lending market for tokenized real-world assets, launched in August 2025. Institutional borrowers post tokenized securities as collateral and borrow stablecoins. The supply side is split: anyone can deposit stablecoins to earn yield (permissionless), while collateral assets are permissioned, onboarded through tokenization issuers who handle KYC and AML for institutional participants. Horizon serves a strategically distinct function as a bridge between permissionless DeFi liquidity and regulated institutional capital.
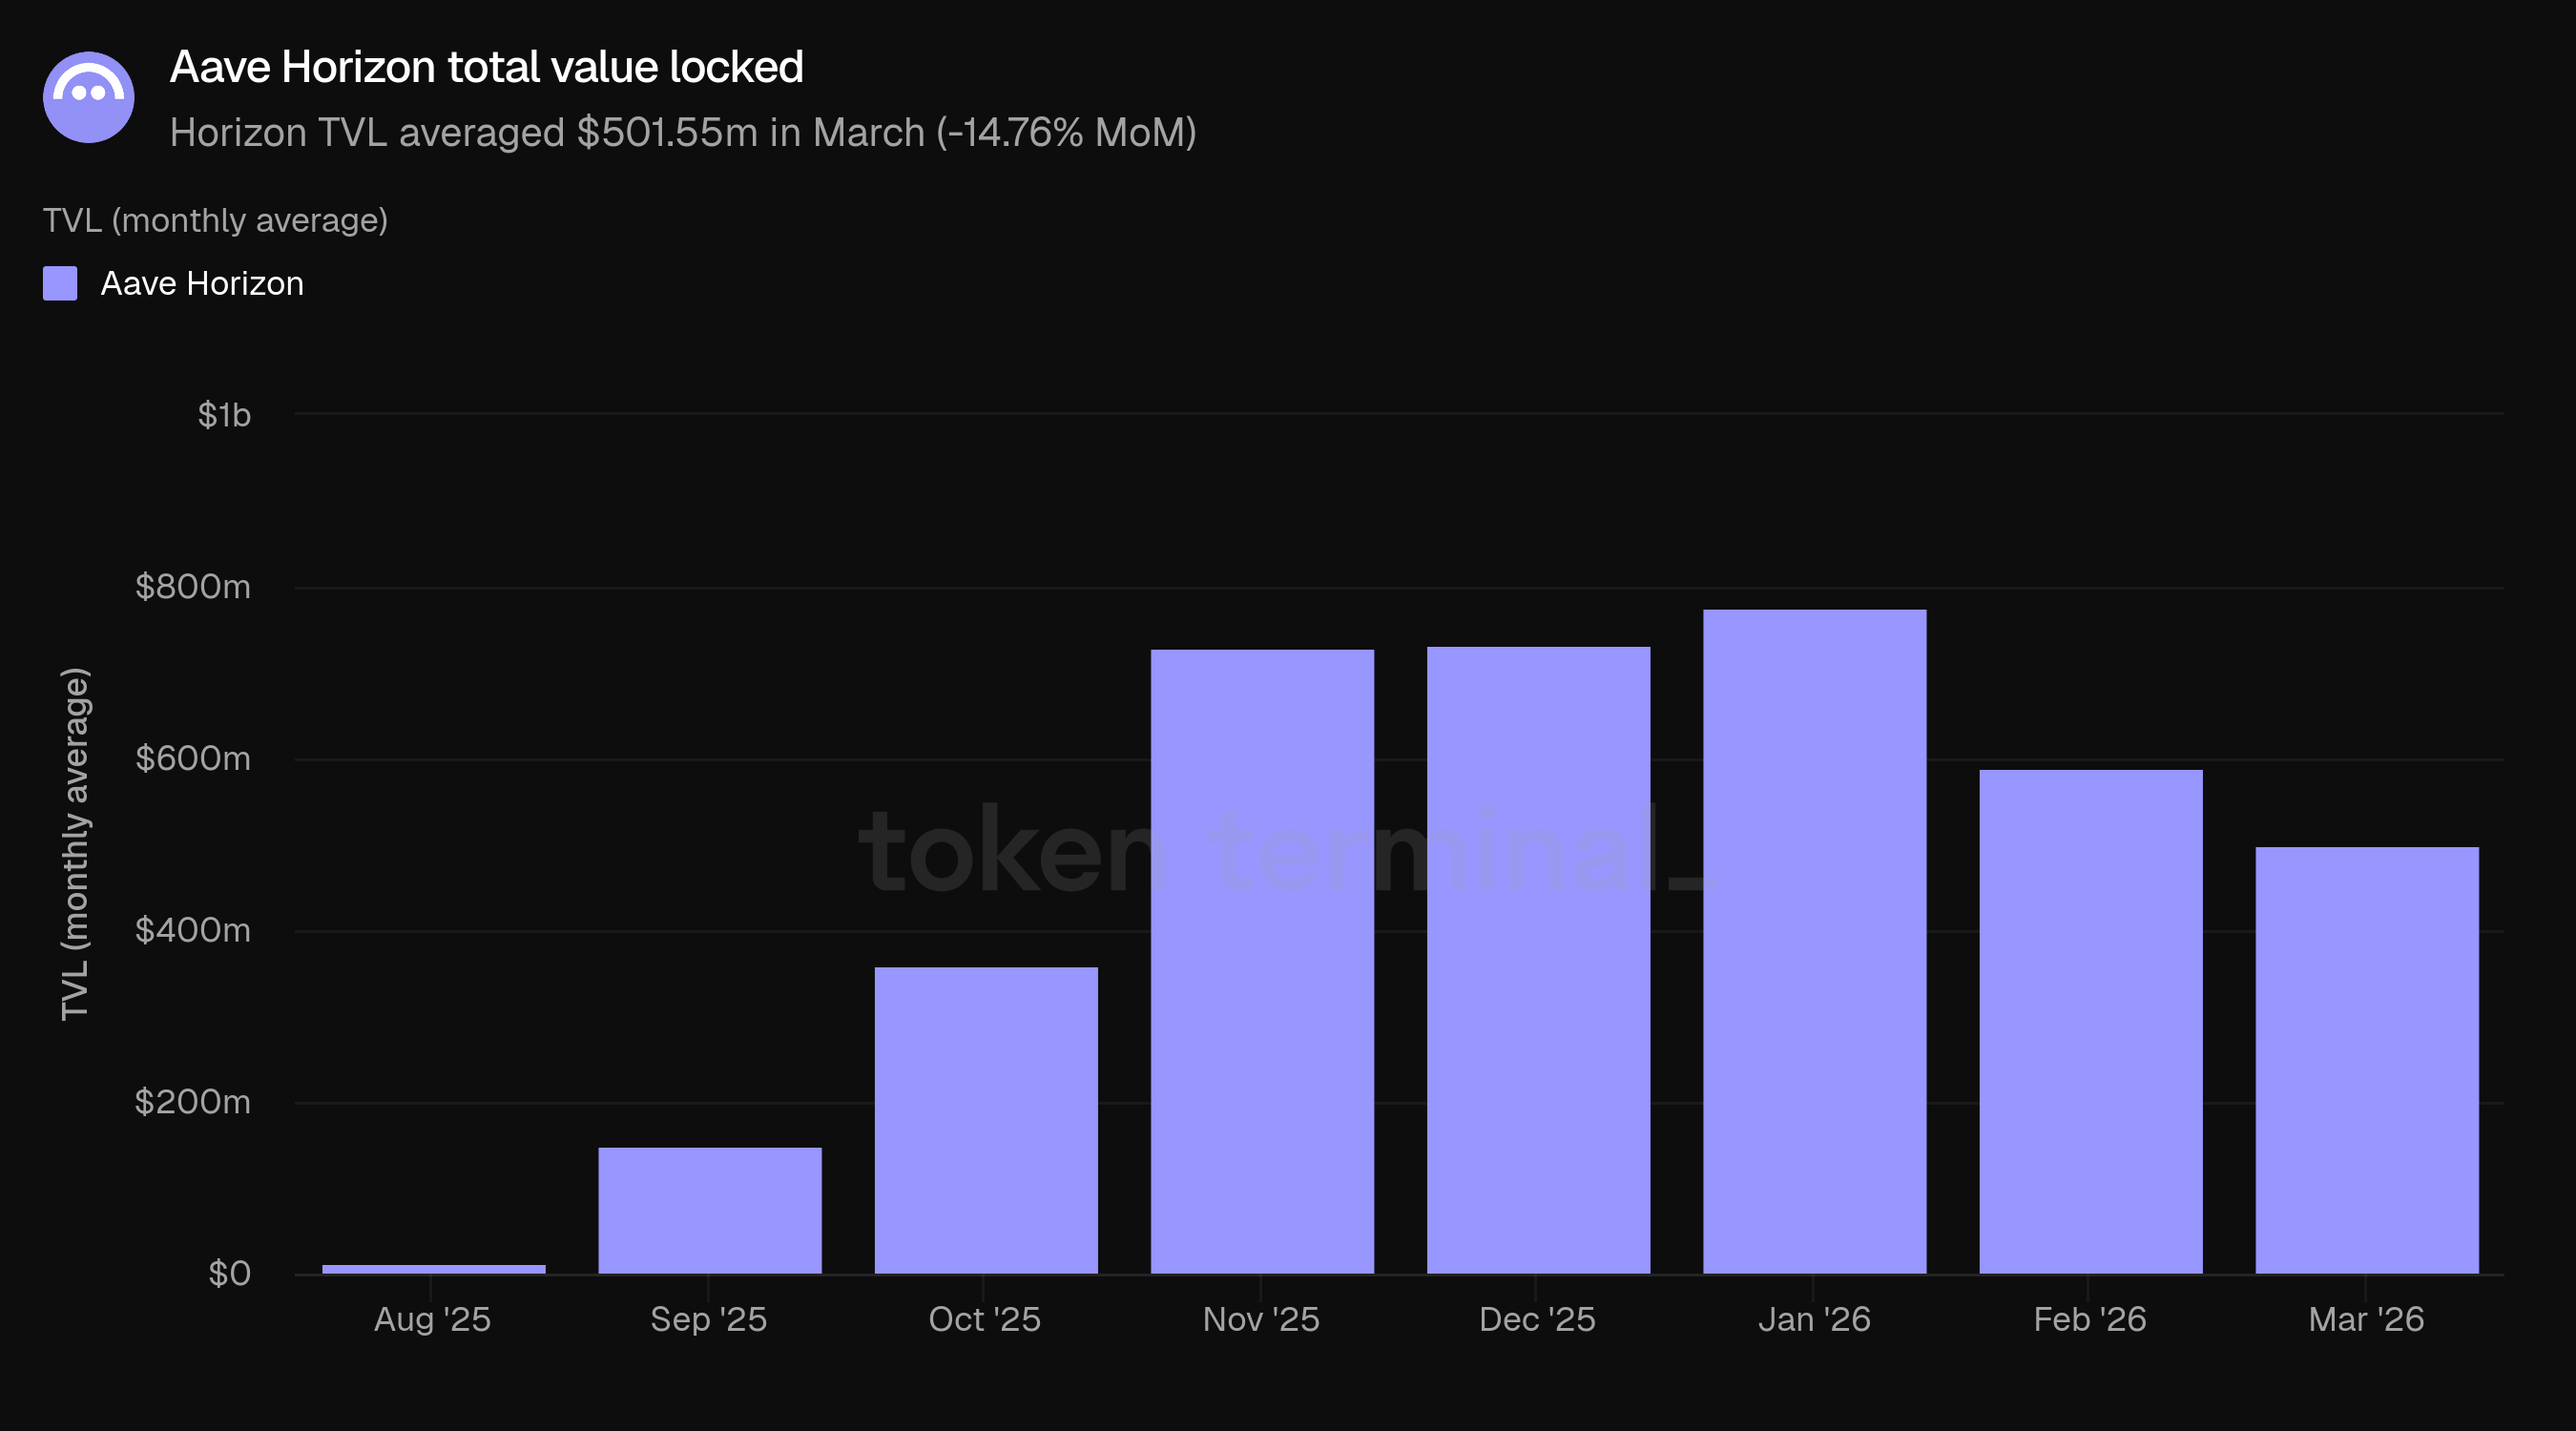
Horizon total value locked measures the total USD value of collateral deposited into Aave Horizon and outstanding loans. March Horizon TVL averaged $501.55m, down 14.76% from February's $588.40m. Horizon TVL peaked at $775.95m in January 2026 and has declined over the past two months. Horizon grew rapidly from its August 2025 launch ($14.30m) through January, a trajectory that coincided with the broader expansion in tokenized asset activity onchain.
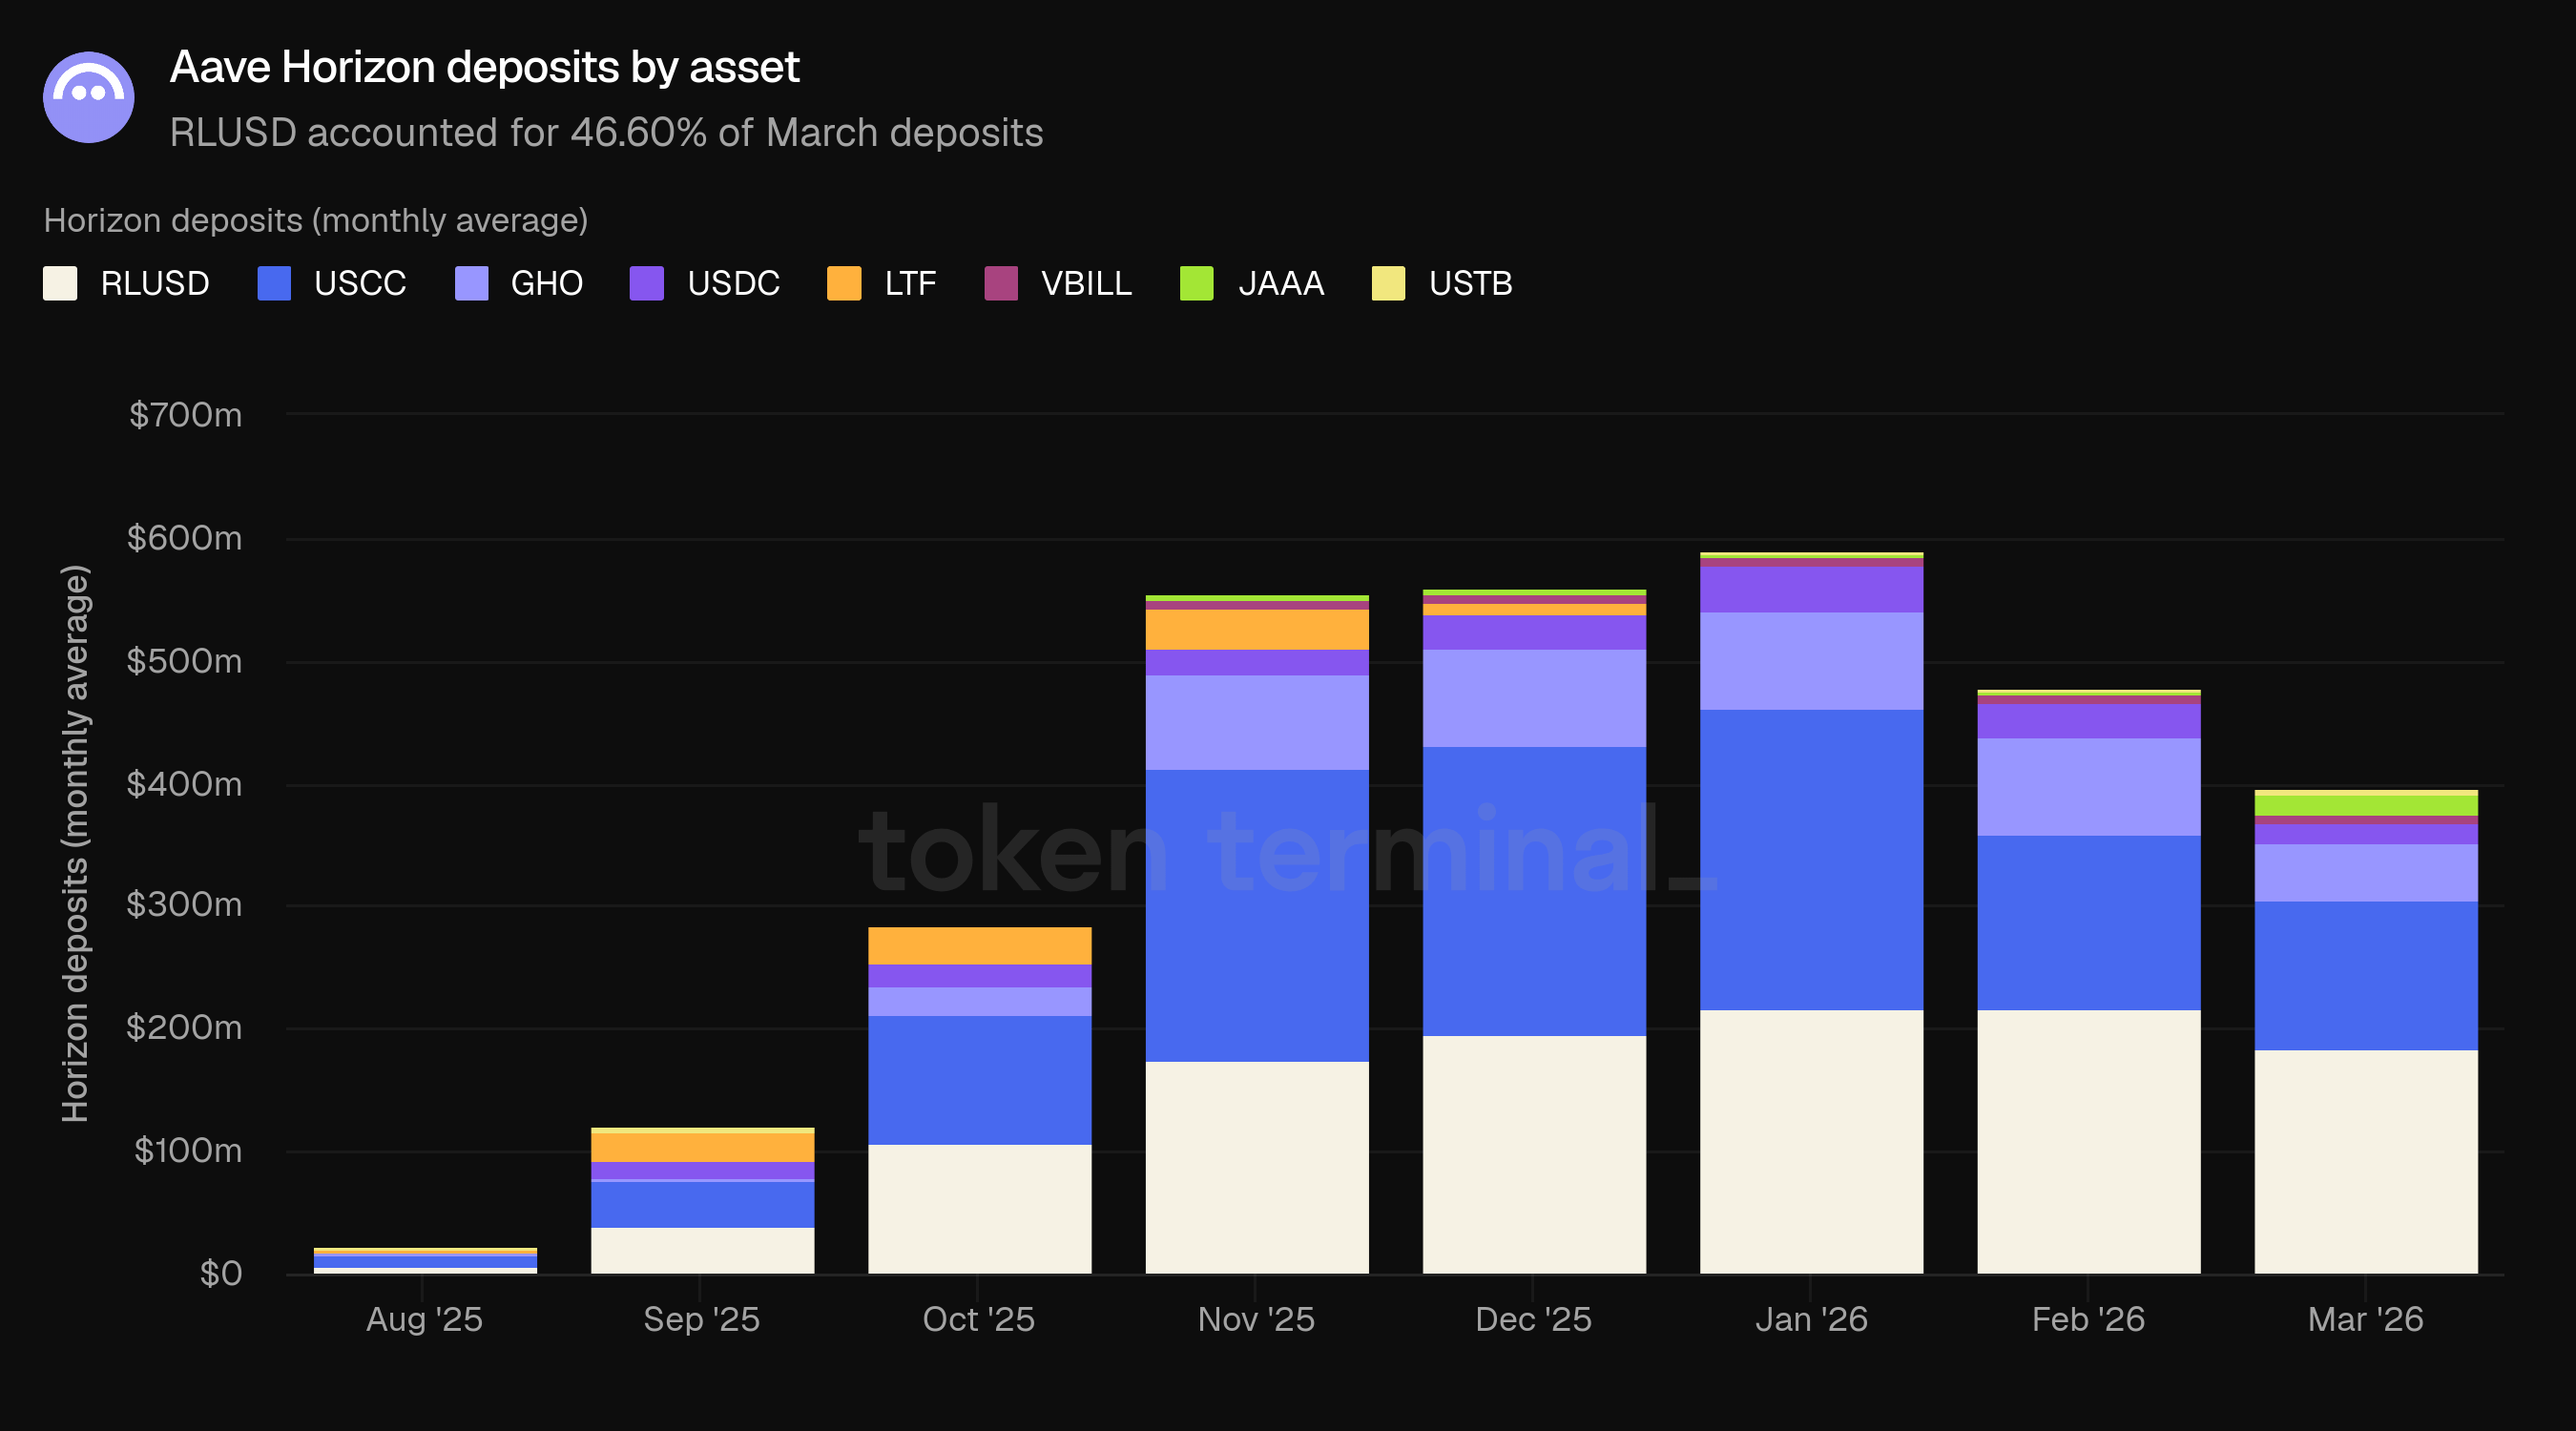
Horizon deposits measures the total USD value of assets supplied to Horizon's markets. March deposits averaged $395.50m, down 17.13% from February's $477.24m. Deposits comprise two types: permissionless stablecoin supply (RLUSD, GHO, USDC) and permissioned RWA collateral deposited by institutional investors through tokenization issuers (USCC, JAAA, VBILL).
RLUSD was the largest deposit asset at $184.30m (46.60%), followed by USCC at $120.95m (30.58%), GHO at $46.37m (11.72%), JAAA at $17.82m (4.51%), USDC at $16.66m (4.21%), and VBILL at $6.25m (1.58%). Stablecoins collectively accounted for 62.54% of deposits ($247.33m), with permissioned RWA collateral at 37.47% ($148.18m). USCC was the largest permissioned RWA asset. The deposit decline was broad-based, with both stablecoin supply and RWA collateral contracting: RLUSD fell from $216.25m to $184.30m (-14.78%), USCC from $143.75m to $120.95m (-15.86%), and GHO from $79.59m to $46.37m (-41.74%).
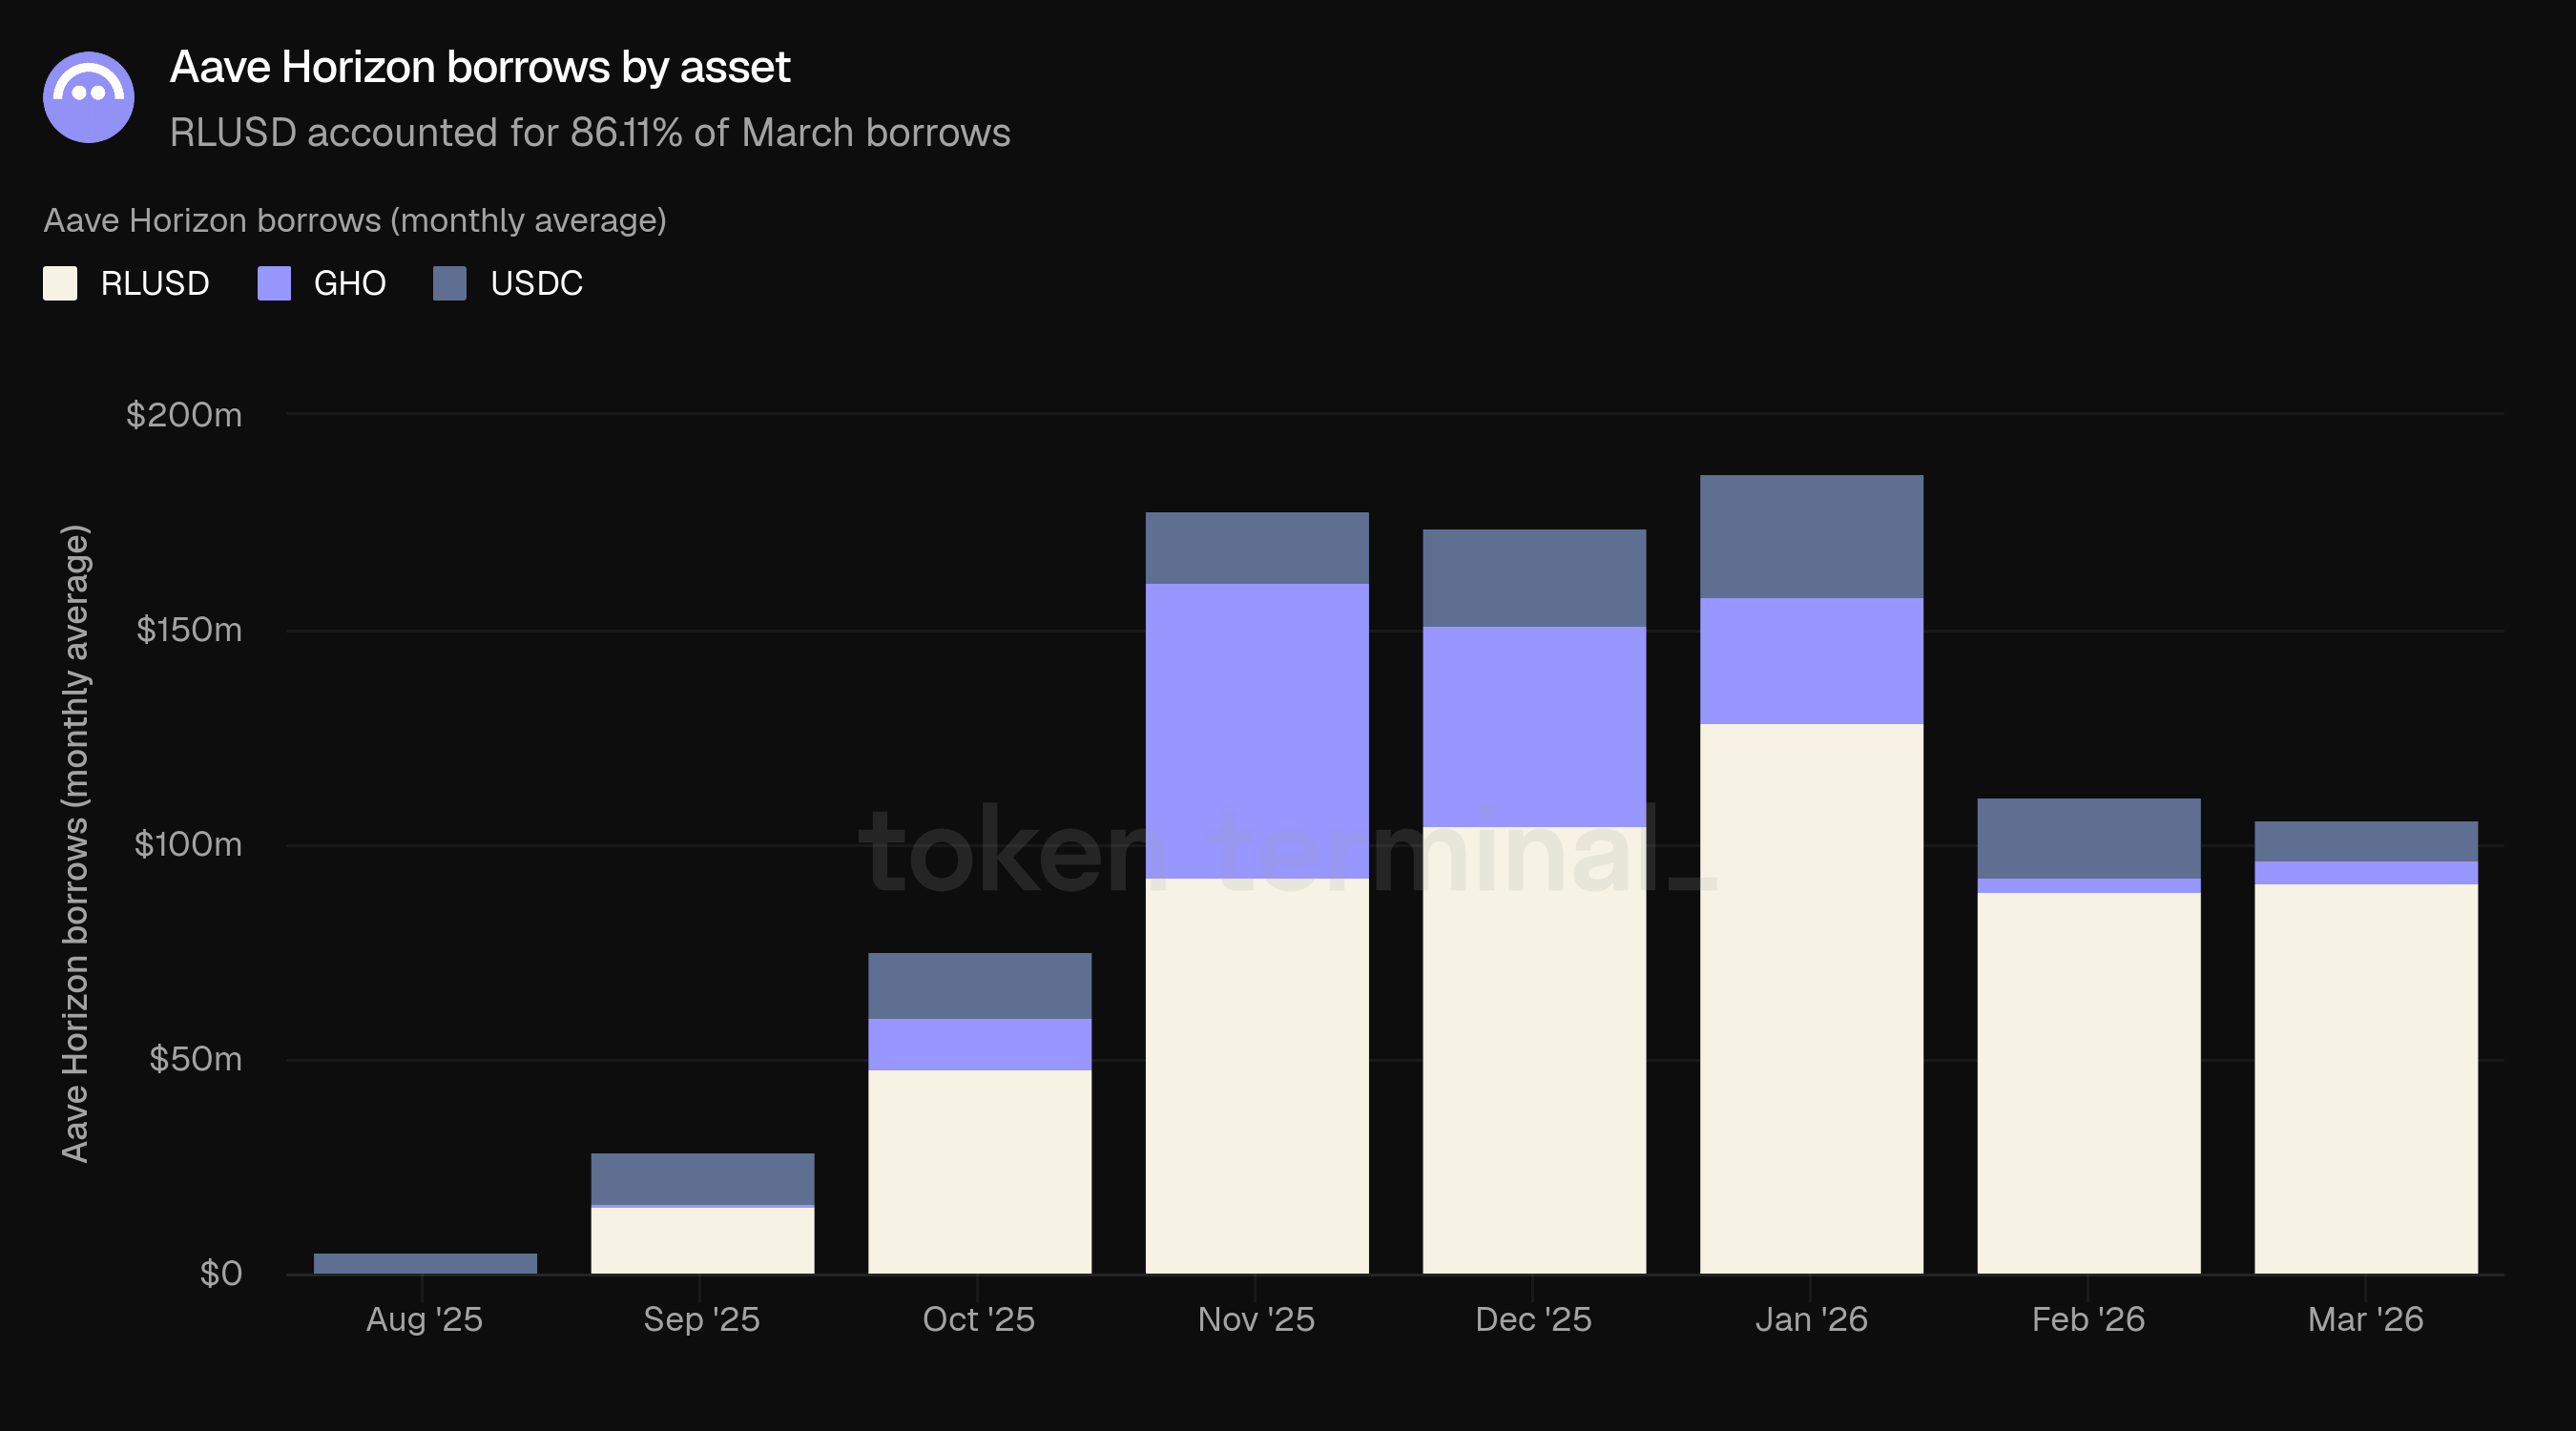
Horizon borrows measures the total USD value of stablecoins borrowed against collateral in Horizon's markets. March borrows averaged $106.05m, down 4.60% from February's $111.15m. Three stablecoins are available to borrow: RLUSD ($91.43m, 86.22%), USDC ($9.56m, 9.01%), and GHO ($5.06m, 4.77%). Borrows peaked at $186.64m in January 2026.
Borrows declined far less than deposits (-4.60% vs. -17.72%), indicating that borrowing demand on Horizon held up even as the supply side contracted. Utilization (borrows as a share of TVL) rose from 18.89% in February to 21.14% in March.
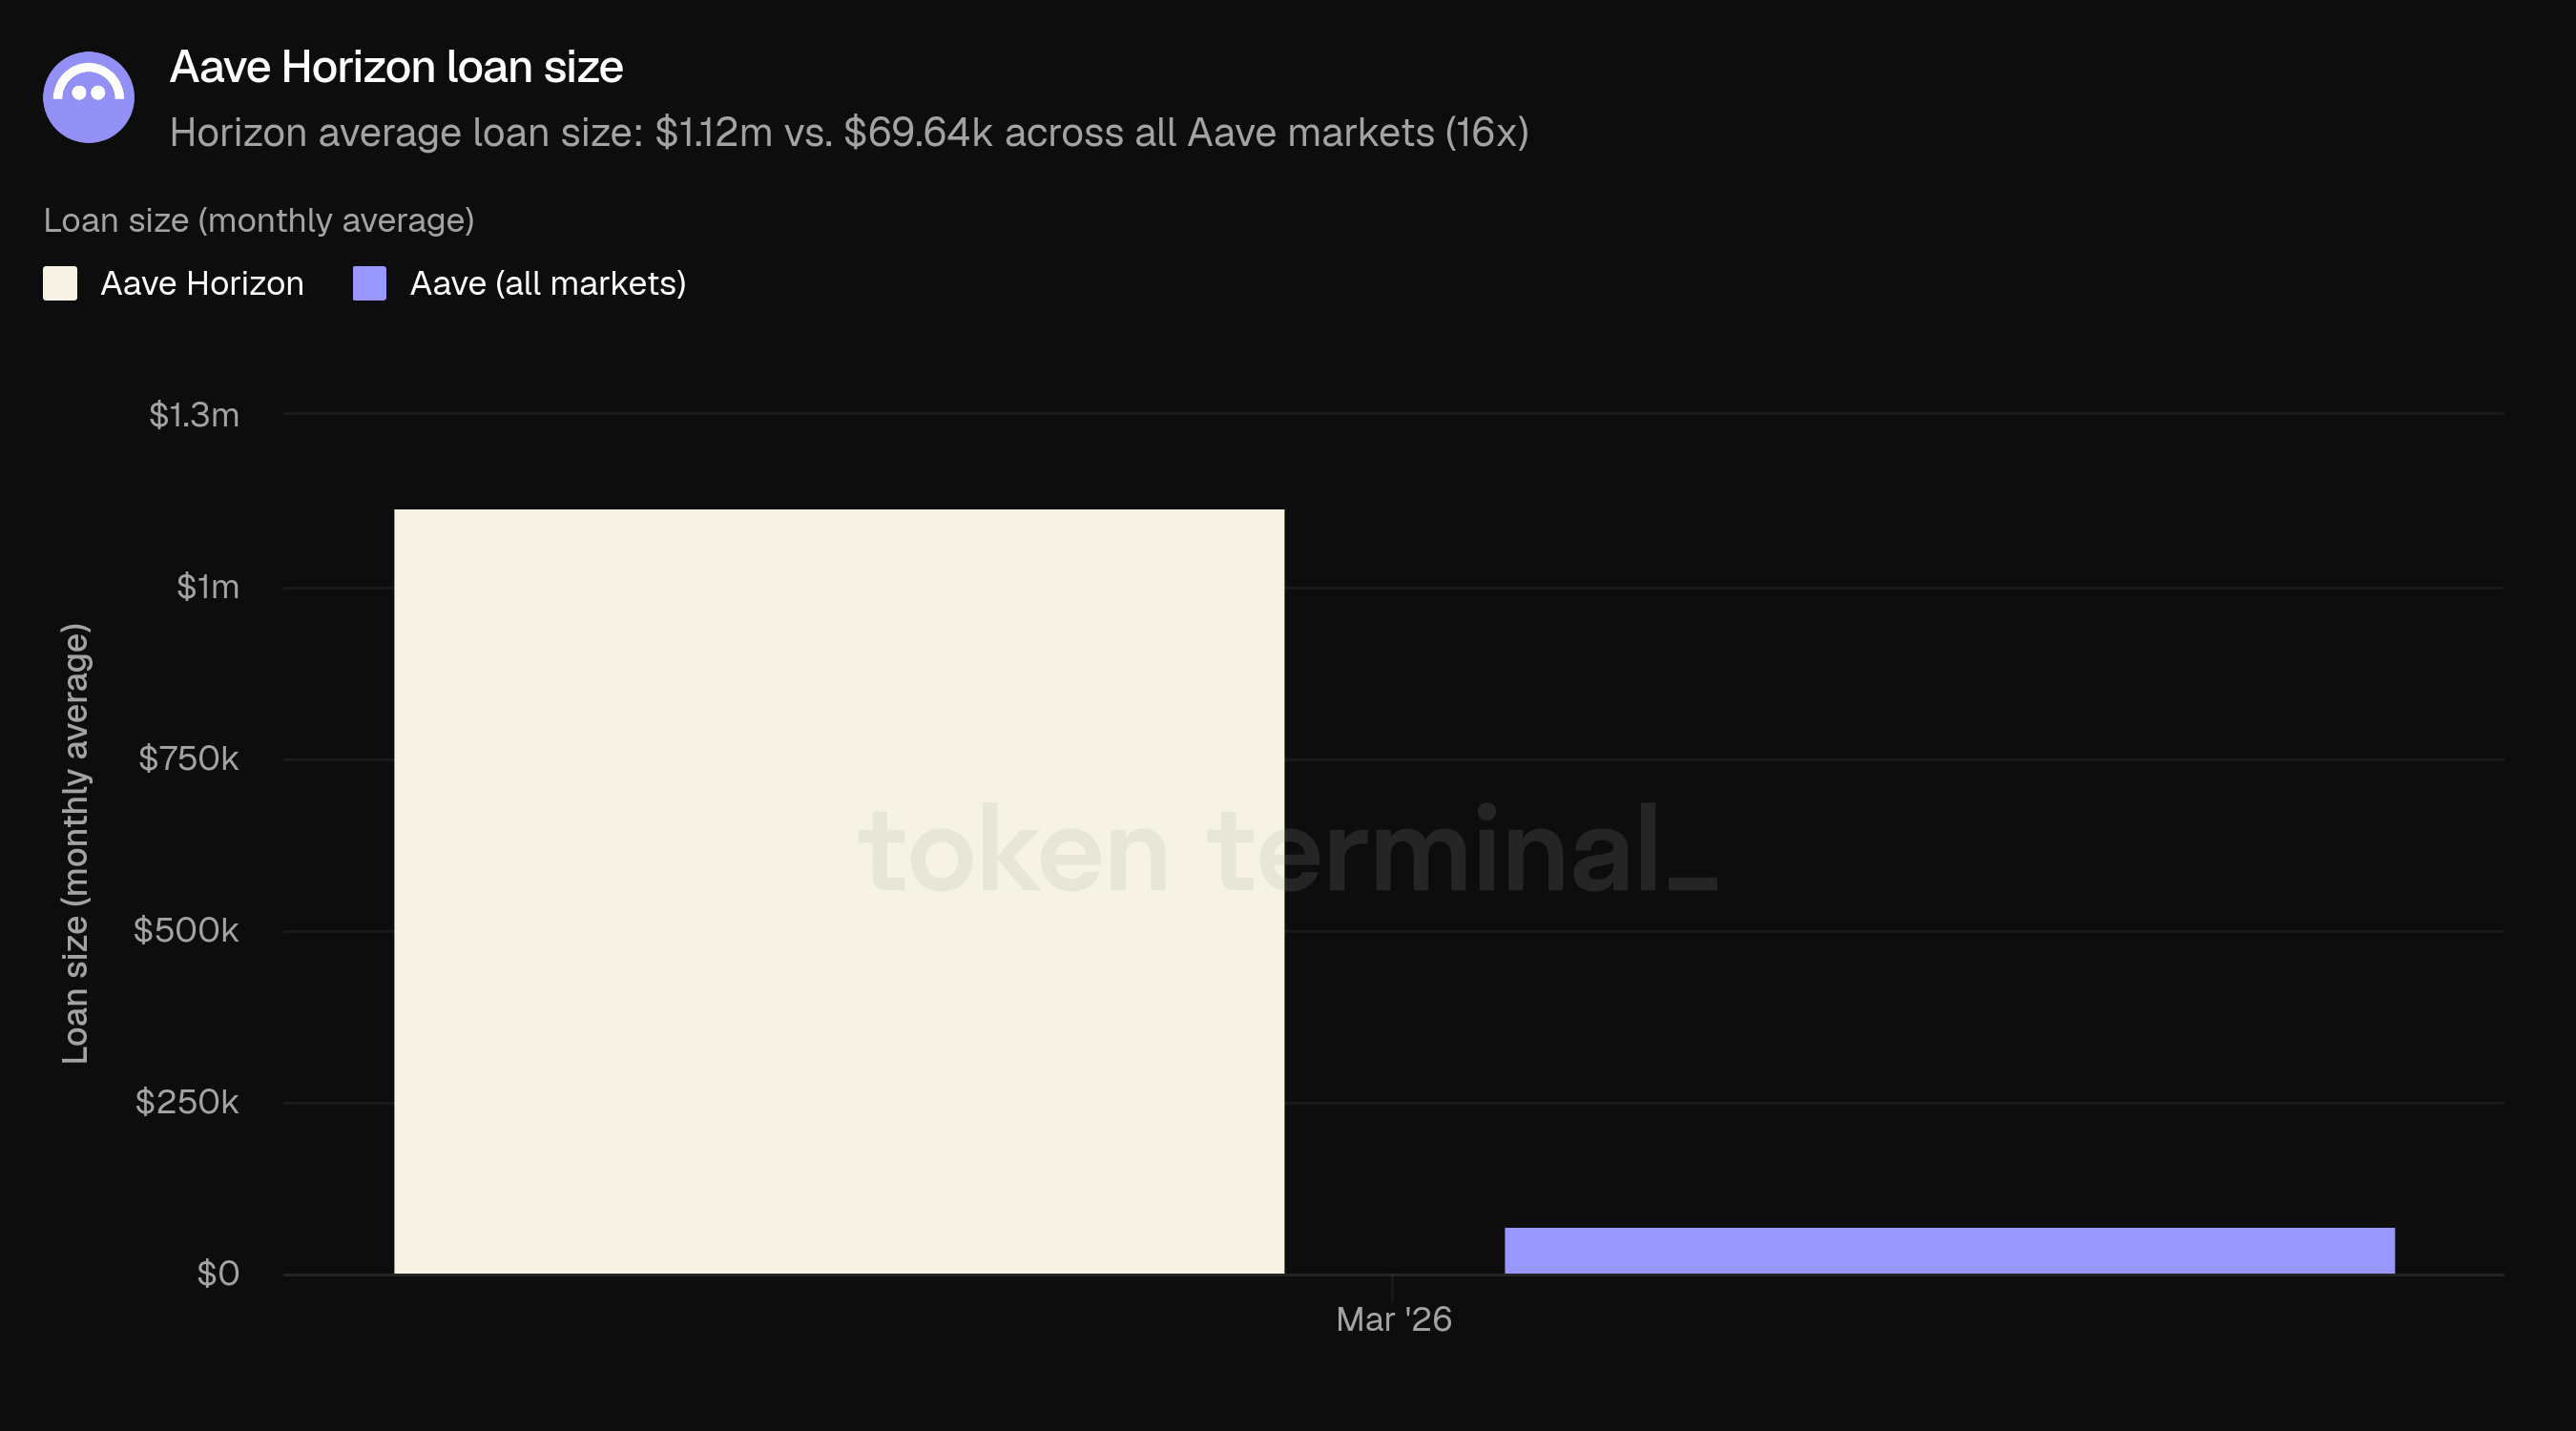
Loan size measures the average USD value of outstanding borrows per borrower. In March, the average Horizon loan was $1.118m, compared to $69.641k across all Aave markets, a 16x difference. This is consistent with Horizon's role as a venue for institutional-scale borrowing against permissioned collateral, in contrast to the retail and DeFi-native activity that characterizes the core lending markets.
10) Outlook
Aave's near-term roadmap is anchored by the buildout of V4 and expansion of its application layer. V4 launched on Ethereum on March 30 with a default borrowing strategy supporting ERC-20 collateral; additional strategies targeting institutional use cases are planned over the remainder of 2026, as outlined during the Q1 livestream. The Aave App, currently in iOS waitlist, is expected to reach full release on iOS and Android in Q2, bringing fixed-rate savings accounts and instant bank transfers to a consumer audience. Aave Kit, the B2B SDK that powers integrations like Whop Treasury and Kraken DeFi Earn, is also expected to launch fully in Q2 alongside new vault infrastructure.
On the institutional side, Aave Horizon is planned to migrate to V4 infrastructure in Q4 2026, which would enable support for a broader set of tokenized collateral types. The "Aave Will Win" proposal, currently in ARFC stage, is expected to move to a governance vote in Q2. If approved, it would direct all application-layer revenue to the DAO treasury, expanding the revenue base beyond protocol fees for the first time.
11) Definitions
Products:
Aave V1: the original version of Aave, launched in January 2020.
Aave V2: the second major version, launched in December 2020.
Aave V3: the current major version, launched in March 2022, enabling multichain deployment and features such as e-mode for improved capital efficiency.
Aave V4: launched on Ethereum in late March 2026. Introduces a hub-and-spoke architecture where shared liquidity pools (hubs) connect to modular borrowing strategies (spokes).
Aave Horizon: a permissioned lending market for tokenized real-world assets, launched in August 2025. Stablecoin supply is permissionless; collateral onboarding is managed by tokenization issuers.
Aave Kit: a unified SDK and API suite that enables enterprises, fintechs, and wallet providers to integrate Aave's lending markets into their own products.
Aave Pro: the web interface for interacting with V4 and GHO, designed for sophisticated DeFi users. Launched alongside V4 in late March 2026.
GHO: Aave's native decentralized stablecoin, launched in 2023. Borrowers mint GHO using their Aave collateral.
Metrics:
Total value locked: measures the total USD value of collateral deposited into Aave and outstanding loans.
Active loans: measures the total USD value of outstanding borrows across all Aave lending markets.
GHO market cap: measures the circulating market capitalization of GHO, Aave's native decentralized stablecoin.
GHO transfer volume: measures the total USD value of GHO transferred onchain over a given period.
Fees: measures the total USD value of fees paid by users across all of Aave's lending markets, aggregated across all income types (see below).
Revenue: measures the total USD value of fees retained by the Aave DAO, aggregated across all income types (see below).
Monthly active users: measures the number of unique wallet addresses that have interacted with Aave over a rolling 30-day period.
Market share: measures Aave's share of active loans relative to other lending projects.
Loan size: measures the average USD value of outstanding borrows per borrower.
Income types:
Interest: fees paid by borrowers on outstanding loans. A share of interest flows to the DAO treasury as revenue.
Liquidation: fees collected when undercollateralized positions are liquidated.
SVR: revenue recaptured from oracle-related MEV during liquidations via Chainlink SVR.
Flash loan: fees charged on uncollateralized loans that are borrowed and repaid within a single transaction.
Treasury: fees from Aave DAO treasury management activities.
GHO stability module: fees charged on swaps between GHO and other stablecoins through the GHO Stability Module.
12) About this report
This report is published monthly and produced leveraging Token Terminal's end-to-end onchain data infrastructure. All metrics are sourced directly from blockchain data. Charts and datasets referenced in this report can be viewed on the corresponding Aave March 2026 Report dashboard on Token Terminal.