
$BTC, $GOLD & $OIL Analysis — Full-Scenario Market Impact Report
The GrandBoard | @BridgeholeMacro | April 5, 2026
Exclusive Intelligence Report
Executive Summary
The Strait of Hormuz — a 21-mile waterway that channels 20% of the world's oil and 20% of its liquefied natural gas — has been functionally closed since February 28, 2026. What began as a retaliatory Iranian blockade following the U.S.-Israeli joint strike has become the largest supply disruption in oil market history. Brent crude has breached $110. The S&P 500 has shed 4.35% in a month. The U.S. Dollar Index has surged past 100. And gold — the traditional crisis safe-haven — has done something almost no one predicted: it crashed 8% from its February peak.
Why did gold fail? The answer is the dollar. When oil surges, inflation expectations spike, Treasury yields follow, and the dollar strengthens — crowding out non-yielding assets like gold. This report calls it the "Hormuz Paradox": the same crisis that should pump gold higher is the very mechanism pushing it lower.
KEY INSIGHT
The Hormuz Paradox affects $OIL, $GOLD, and $BTC through the same transmission mechanism: oil surges → yields spike → dollar strengthens → non-yielding assets crushed.
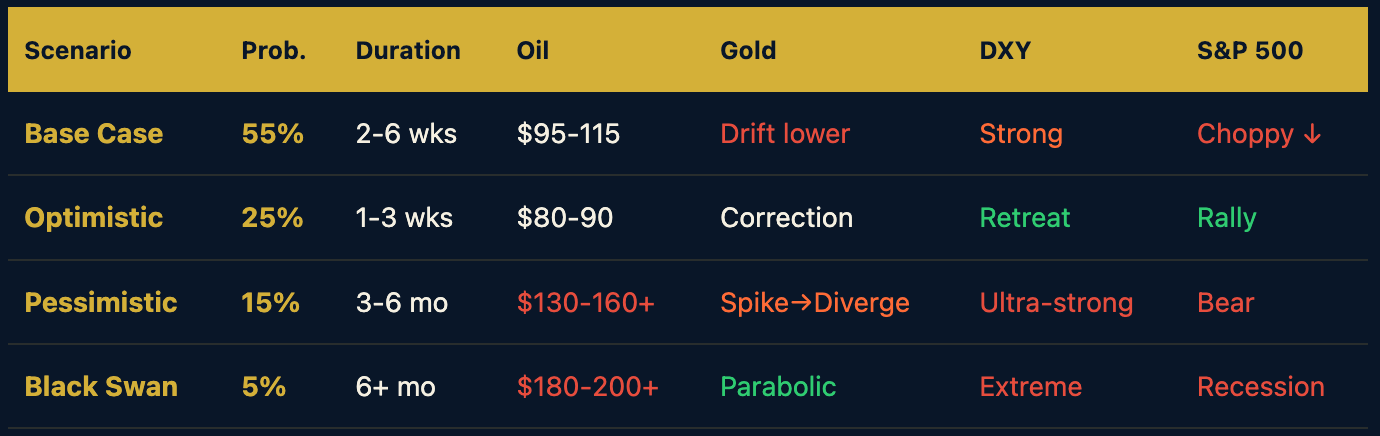
Four Scenarios at a Glance
Chapter 1: Crisis Background & Timeline
How Lethal Is the Strait of Hormuz?
The Strait of Hormuz is not just another shipping lane. It is the world's most critical energy chokepoint. At its narrowest, only 21 miles separate the Iranian and Omani coastlines — and the navigable channel for tankers is just 2 miles wide. Through this pinch point flows approximately 21 million barrels of crude oil per day (pre-crisis), along with 20% of global LNG trade. Shut it down, and you don't just inconvenience the market — you amputate a limb from the global economy.
Key Numbers:
21 million bpd — Pre-crisis daily oil transit (Rapidan Energy estimate)
5 million bpd — Saudi Arabia's East-West Pipeline (Petroline) capacity to Yanbu
1.5 million bpd — UAE's Habshan-Fujairah pipeline bypass capacity
$400,000+ — War risk insurance premium per VLCC transit (up from ~$100,000 pre-crisis)
$8-14/bbl — Estimated geopolitical risk premium baked into current oil prices
10-14 days — Additional sailing time via Cape of Good Hope alternative route
The Timeline: From Strike to Blockade
February 28, 2026 — U.S. and Israeli forces launch joint airstrikes on Iranian nuclear and military installations. Iran's response is swift and deliberate: the IRGC begins laying naval mines in the Strait of Hormuz and deploying fast-attack patrol boats to enforce a shipping blockade.
March 1-3, 2026 — Oil prices spike. Brent surges past $100. Markets panic. Trump tweets that he will "insure and protect all oil and LNG tankers" — briefly stabilizing prices. The DXY surges 1.07% to 99.42 as global capital flees to the dollar. S&P 500 enters correction territory.
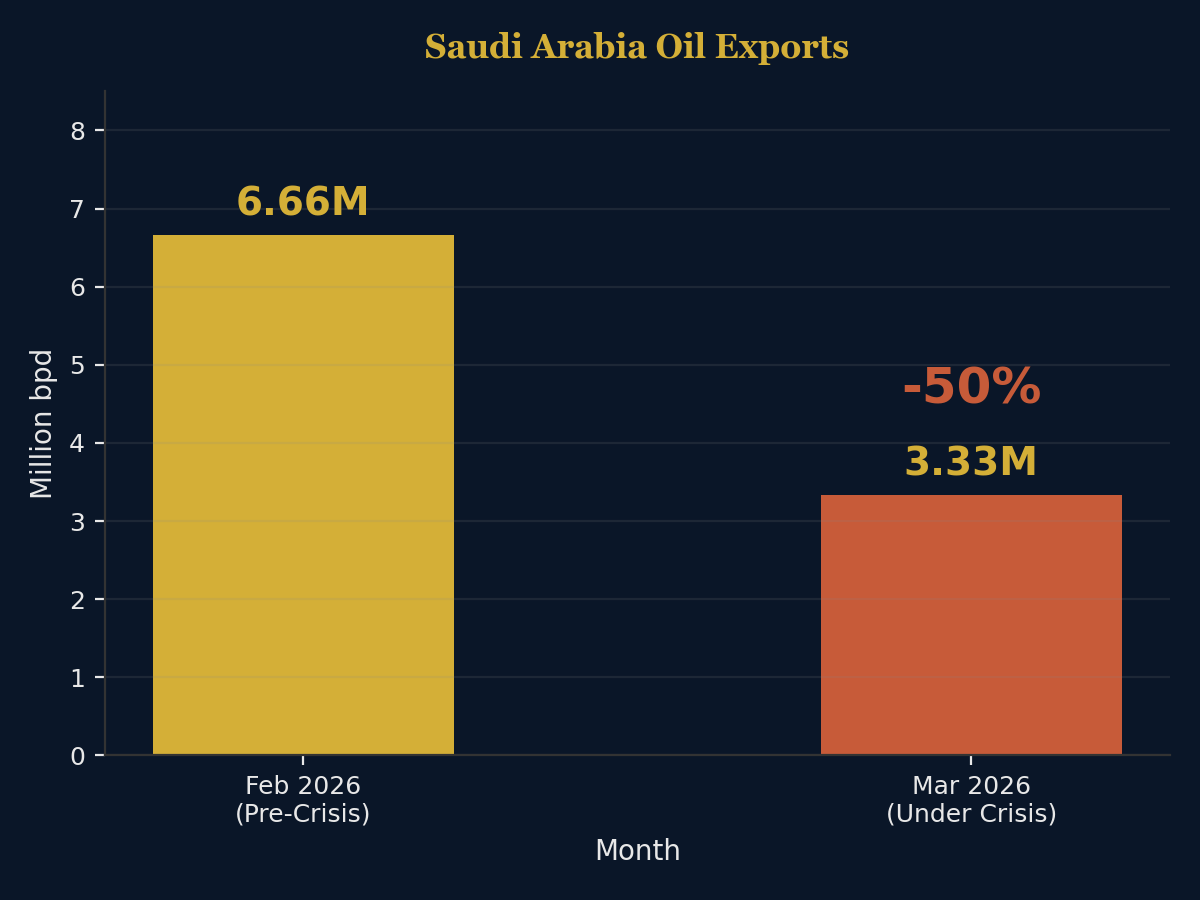
March 4-7, 2026 — Saudi Aramco activates the East-West Pipeline (Petroline), rerouting crude to the Red Sea port of Yanbu. The pipeline's capacity: 5 million bpd — but pre-crisis Saudi exports through Hormuz totaled roughly 6.66 million bpd. The math doesn't work. Gap: ~1.66 million bpd unaccounted for.
March 8-15, 2026 — Insurance premiums explode. War risk insurance for a single VLCC transit surges past $400,000. The Strait enters "virtual closure" — not officially shut, but economically impassable.
March 16-31, 2026 — Saudi pipeline hits 7 million bpd (Fortune, citing insiders). But this is maximum capacity under emergency conditions — not sustainable long-term. The S&P Global Services PMI drops to 49.8 — the first contraction in three years. The "great rotation" begins: capital shifts from tech to energy.
April 1-5, 2026 — Week 5. USS George H.W. Bush carrier strike group departs Norfolk. Total U.S. troop surge: 10,000+. Trump tweets "PEACE IS NEAR!" Iran publicly denies any negotiations. Brent fluctuates $108-112. Gold stabilizes around $4,675 after crashing from $5,296. DXY holds above 100.
Chapter 2: Historical Replay
Every oil shock is different. But every oil shock rhymes. Understanding where 2026 fits in the historical pattern is the single most valuable analytical exercise you can do right now.
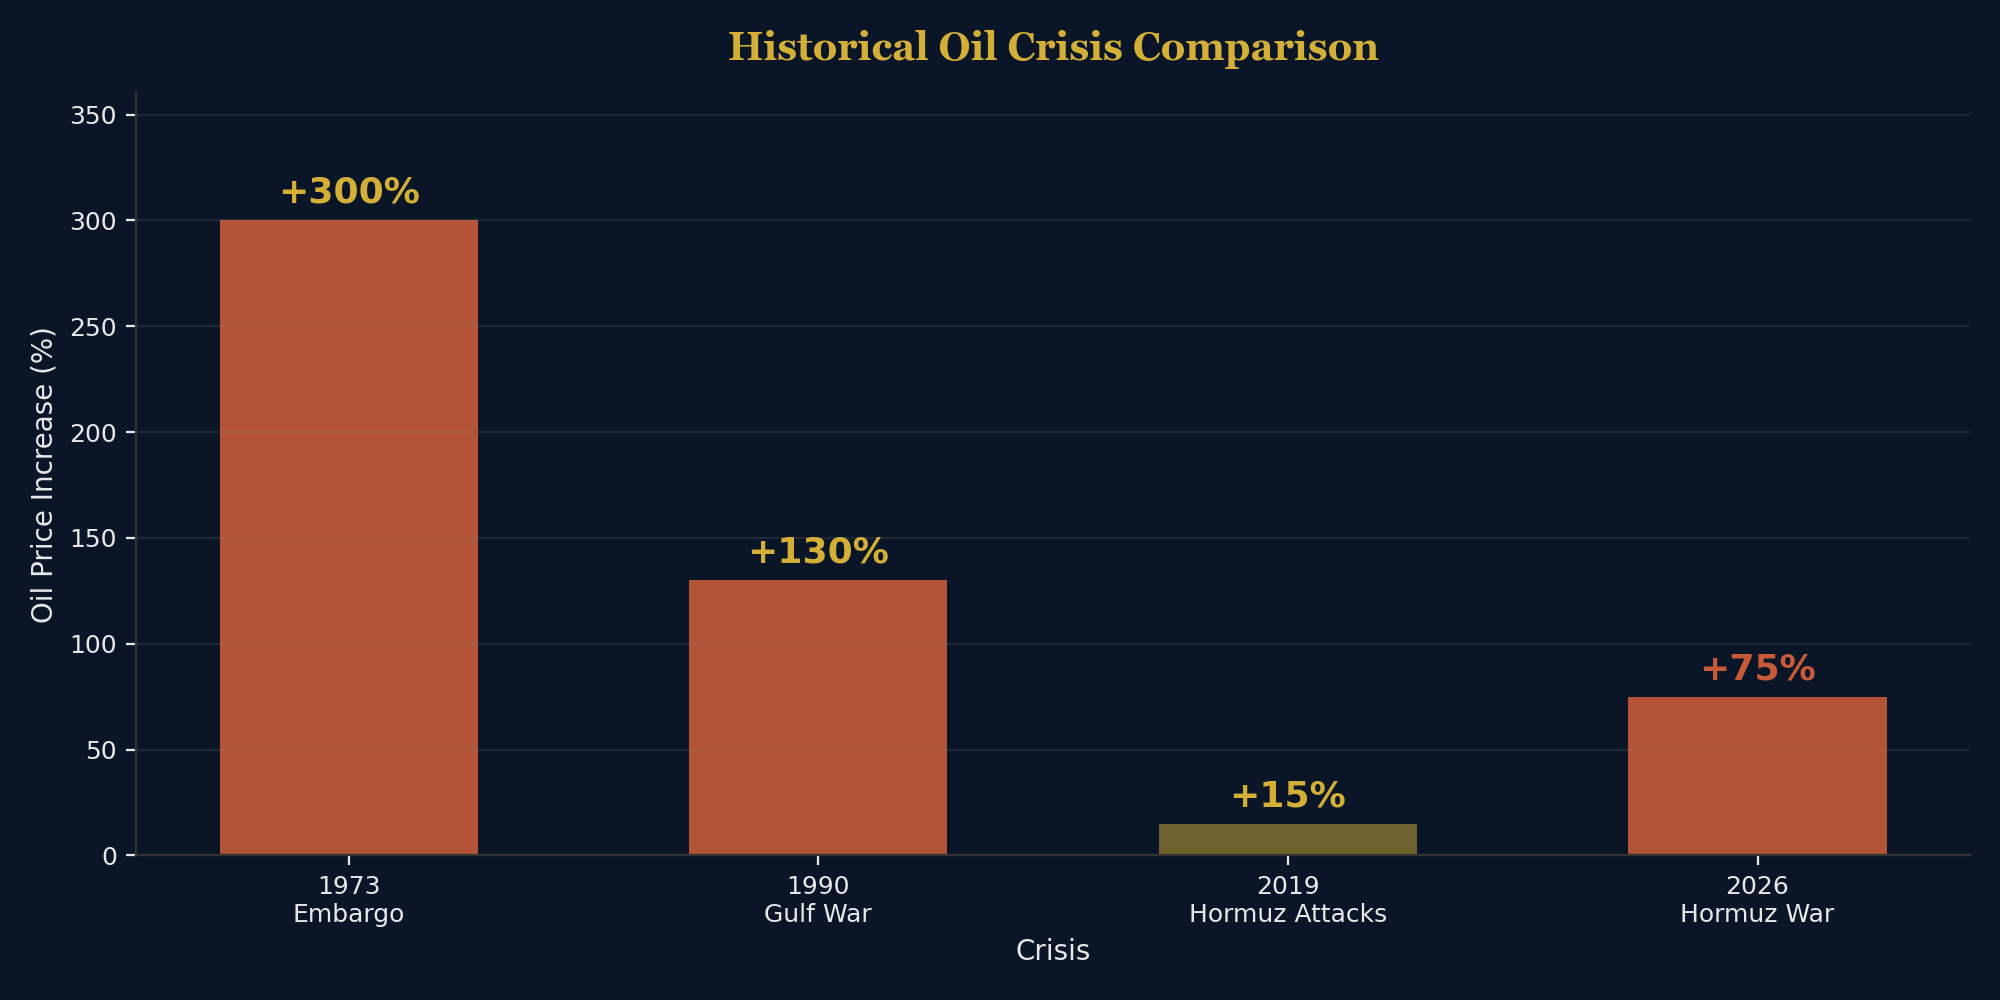
The 2026 crisis combines the worst elements of two previous shocks:
From 1973: The supply magnitude. When Arab OPEC members embargoed oil exports in 1973, they cut roughly 4-5 million bpd — about 7-8% of world demand. The Hormuz closure is blocking approximately 20 million bpd — roughly 20% of global supply. In absolute terms, this is the largest supply disruption in recorded oil market history.
From 2022: The inflation transmission mechanism. When Russia invaded Ukraine, energy prices surged, but the shock was partially absorbed by a global economy still flush with pandemic stimulus. In 2026, the post-pandemic economy is more fragile. The S&P Global Services PMI has already dropped to 49.8 (contraction territory). Central banks are barely done fighting the last inflation wave. A second energy shock on top of existing inflationary pressures is the stuff central bankers have nightmares about.
Why Traditional Military Solutions Don't Work: Iran's "underground missile cities" — vast subterranean facilities housing thousands of ballistic missiles — make a conventional military solution vastly more complex. Iran's "ghost fleet" of unflagged tankers and proxy-controlled smuggling networks means the Strait can be disrupted without a single Iranian naval vessel visibly operating. You can destroy the minesweepers. You cannot destroy the idea.
Chapter 3: Full Scenario Analysis
This is the core of the report. Each scenario is probability-weighted, time-bound, and asset-specific. These are not guesses — they are extrapolations from historical precedent, current military positioning, and market structure.
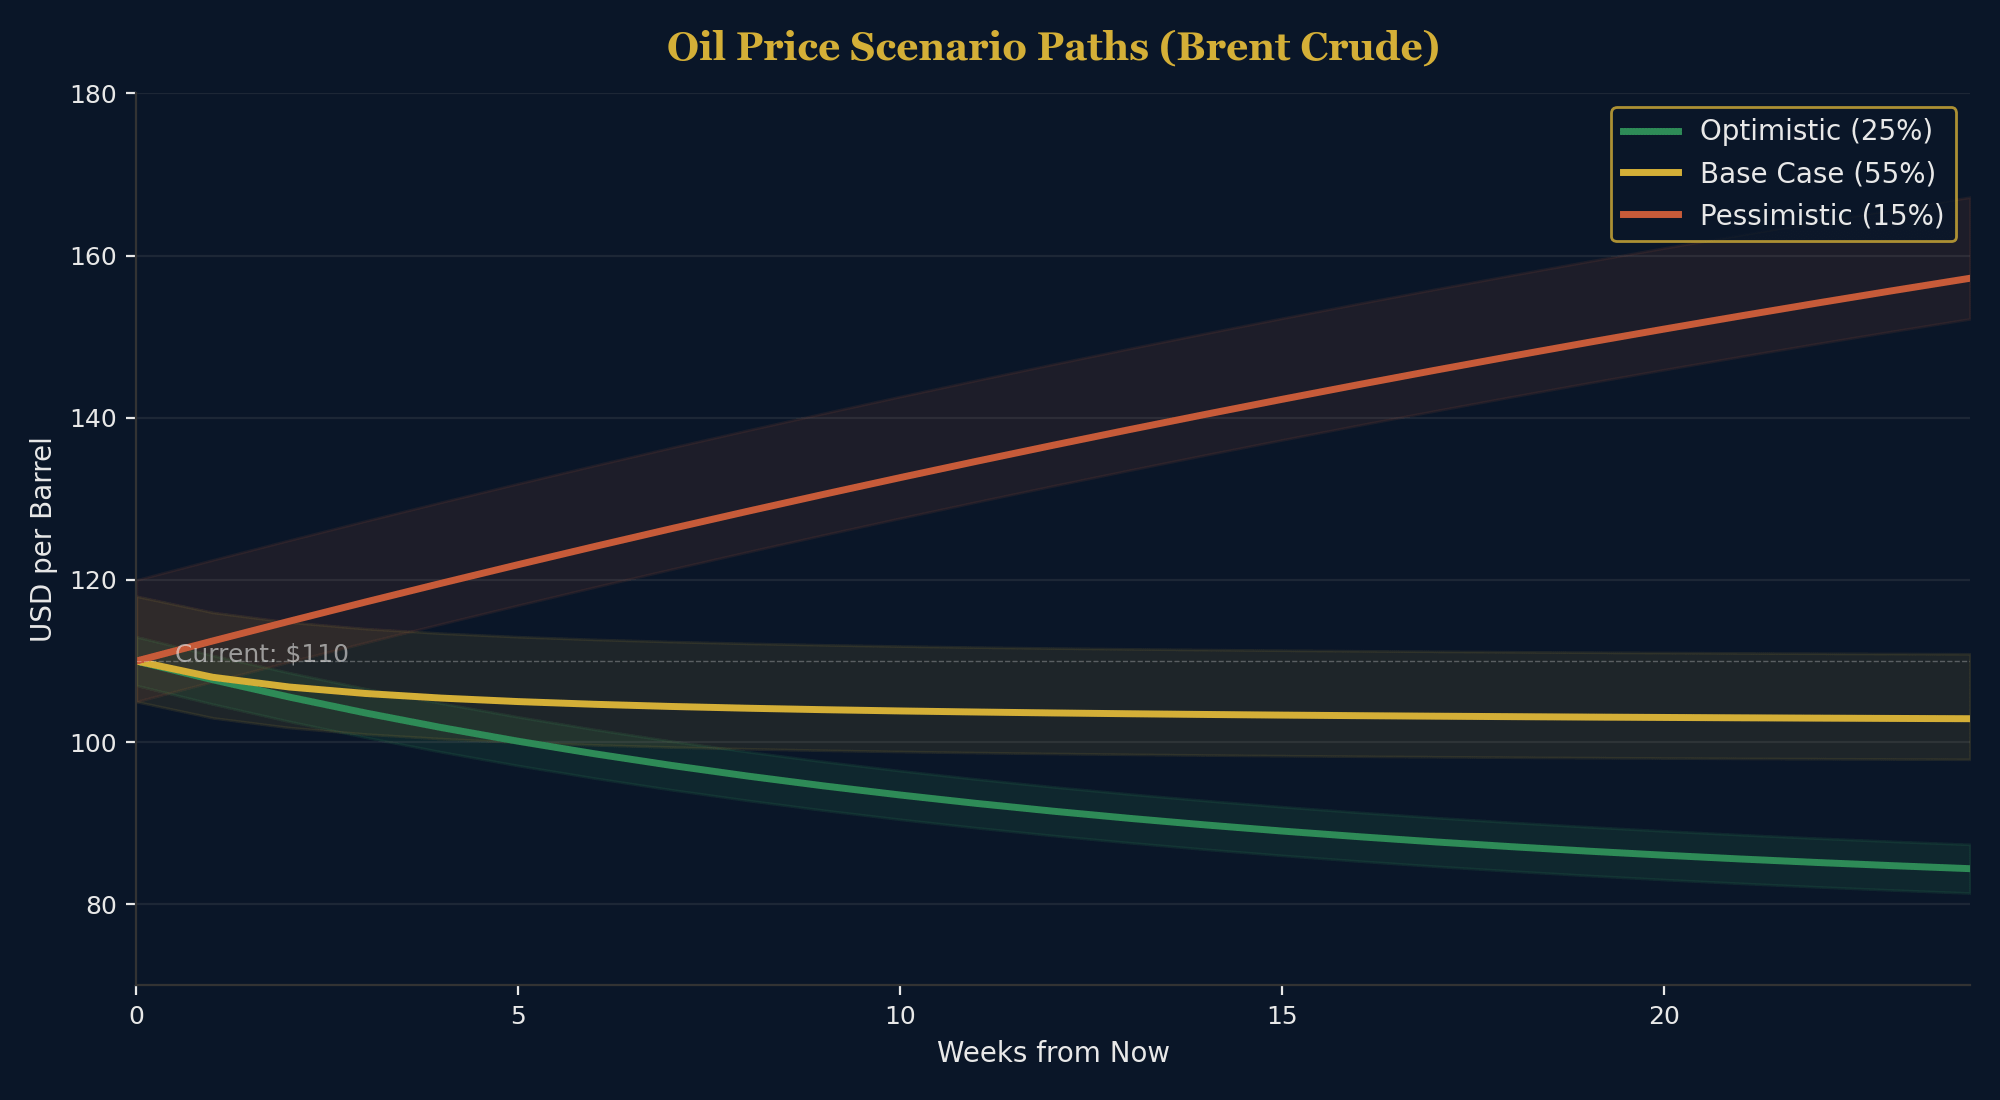
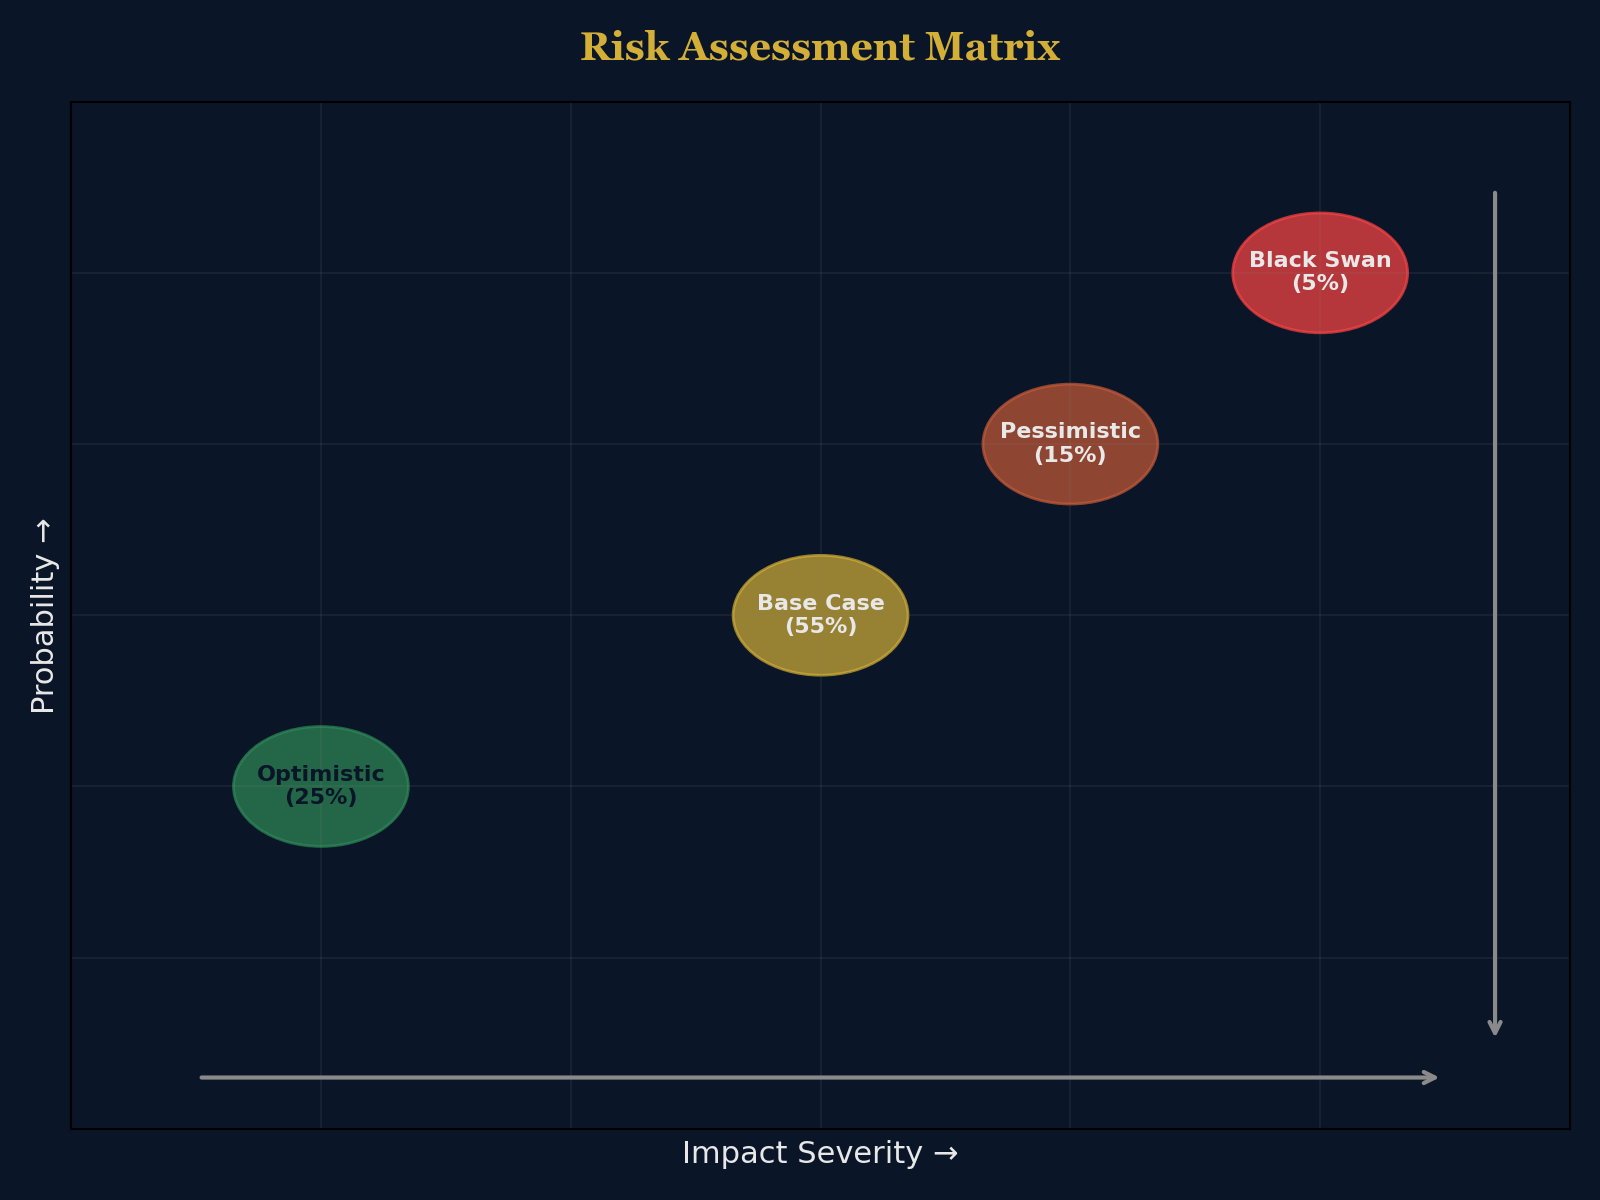
Scenario 1: Base Case — "The Messy De-Escalation" (55%)
By late April, U.S. military buildup reaches critical mass. Two carrier strike groups, 10,000+ troops create enough pressure for a partial deal. The Strait "technically" reopens — a "humanitarian corridor" or "phased de-mining" arrangement dressed up as a diplomatic breakthrough.
Oil drops from $110 toward $95-100, then stabilizes in the $95-115 range
Gold continues drifting lower as dollar strength persists
DXY remains strong above 100 as capital rotation continues
S&P 500 stages a relief rally, then fades
Key pivot indicator: Daily transit count through Hormuz returning above 5 vessels/day.
Scenario 2: Optimistic — "The Trump Victory Lap" (25%)
Trump's pressure campaign works better than expected. A comprehensive ceasefire includes phased Strait reopening. Oil crashes. Markets rally.
Oil collapses from $110 toward $80-90 within days
Gold drops further — potentially testing $4,300
DXY retreats from 100+ toward 97-98
S&P 500 rallies 5-8% as "risk-on" returns
Scenario 3: Pessimistic — "The Long Hot Summer" (15%)
Iran's IRGC refuses meaningful negotiation. The Strait remains closed past 60 days. The U.S. launches ground operations. Iran activates proxy forces across the region. The Gulf descends into wider conflict.
Oil surges past $130, testing $150-160
Gold initially spikes, then paradoxically crashes again as dollar strengthens further
DXY breaks through 105-107
S&P 500 enters bear market (-20% from peak)
Scenario 4: Black Swan — "The Multi-Chokepoint Cascade" (5%)
Iran simultaneously targets additional chokepoints — the Suez Canal, the Bab el-Mandeb Strait, or critical pipeline infrastructure. Multiple supply routes disrupted simultaneously. Global oil market effectively loses 35-40% of supply.
Oil explodes past $180, potentially touching $200
Gold surges past $5,500 as the entire financial system seeks any store of value
S&P 500 crashes 30-40%; global equities enter synchronized bear market
Chapter 4: Four Asset Impact Paths
Oil: The Supply Gap Nobody Can Fill
The math is brutal. The Strait of Hormuz channeled approximately 21 million bpd before the crisis. Alternative routes can handle perhaps 7-8 million bpd. The gap: 13-14 million bpd of global supply effectively offline. U.S. shale can add maybe 500,000-1 million bpd within 6 months — a fraction of the shortfall.
With 13-14 million bpd offline, $OIL remains the clearest structural trade in global markets.
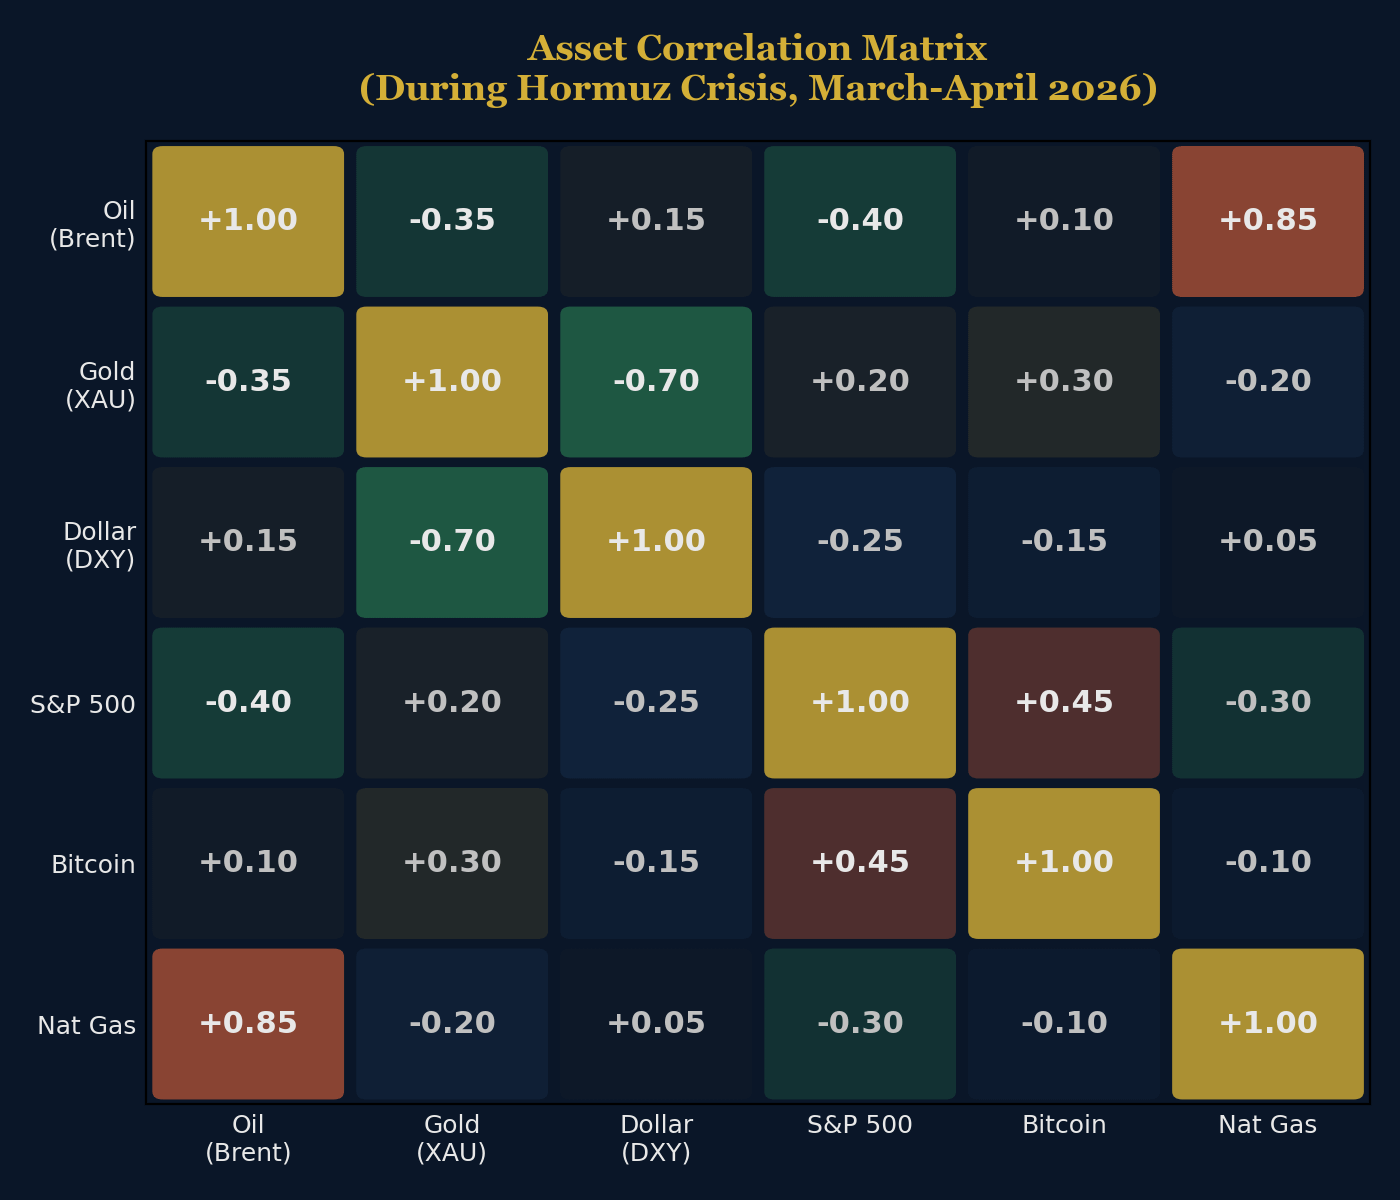
Gold: The Hormuz Paradox Explained
Gold initially spiked from $5,296 to $5,423 on the day of the Hormuz closure — the textbook safe-haven reflex. Then it reversed violently, falling over 8% from its February peak to stabilize around $4,675 by early April.
The mechanism:
Oil surges → Inflation expectations spike → Treasury yields rise
Rising yields → Dollar strengthens (DXY past 100)
Strong dollar + higher yields → Gold (zero-yield asset) gets crushed
Leveraged gold longs get margin-called → Forced selling accelerates
KEY INSIGHT
For digital gold exposure, $PAXG tracks the physical asset more closely than $BTC in this regime.
Dollar: Dual Engine of Petrodollar and Safe-Haven
The DXY has surged past 100 — driven by two reinforcing dynamics. First, the "petrodollar effect": when oil prices are high and denominated in dollars, global demand for dollars increases. Second, the "safe-haven effect": capital flows to the deepest, most liquid market — U.S. Treasuries.
Equities: The Great Rotation
The S&P 500 has declined 4.35% in four weeks — not catastrophic, but deceptive. Energy stocks have surged (XLE up 15-20% since late February). Tech stocks have been hammered (XLK/QQQ down 8-12%).
Sector playbook: Long Energy (XLE), Defense (ITA). Short Consumer discretionary (XLY), Growth tech (QQQ). Watch Financials (XLF). Neutral Healthcare (XLV).
Cryptocurrency: The Fifth Asset — Same Paradox, Louder Pain
The "Hormuz Paradox" transmission mechanism — oil surges → yields spike → dollar strengthens → non-yielding assets crushed — applies to cryptocurrency with even more force than it does to gold. Bitcoin has no 5,000-year monetary history, no central bank reserve status, no industrial floor price. It is, structurally, the most exposed asset class on Earth to the exact macro dynamic the Hormuz crisis has triggered.
The price action: In the first 48 hours after the Strait's closure, BTC rallied 12% as crypto Twitter erupted with "Bitcoin is the new gold" threads. Then the Hormuz Paradox machine kicked in. As Treasury yields spiked and the DXY surged past 100, Bitcoin collapsed 19% from its local high — underperforming even gold's drawdown.
Why crypto fell harder than gold:
Higher average leverage — Bitcoin traders on centralized exchanges operate with significantly more leverage than gold ETF holders, meaning margin calls cascade faster
Weaker institutional holding — gold has central bank reserves as a structural floor; crypto has venture capital and retail momentum, both of which flee first
No safe-haven track record — gold has survived 5,000 years of human catastrophe; Bitcoin has survived exactly zero real geopolitical wars
The DeFi crack: $USDT briefly traded at $0.98 as the Strait closed. Not a crisis — but a stress fracture visible in real time. DeFi protocols backed by Treasury-heavy collateral saw TVL drops of 15-20%. The irony is thick: an industry built on the promise of "banking without banks" discovered that its entire stability depends on the same centralized dollar system it was designed to escape.
KEY INSIGHT
The $USDT depeg to $0.98 proves that $BTC and DeFi are not independent of the dollar system.
Crypto Across the Four Scenarios
Base Case: BTC recovers partially, stays below pre-crisis highs. Dollar strength keeps a ceiling on crypto.
Optimistic: Relief rally. BTC reclaims $90K+. The "digital gold" narrative gets resurrected despite just failing its exam.
Pessimistic: Sustained dollar strength crushes crypto. BTC tests $60K. Liquidations cascade. DeFi protocols with fragile collateral face solvency questions.
Black Swan: Initial panic bid, then catastrophic crash. The entire crypto ecosystem faces a Darwinian moment.
Chapter 5: Trade Frameworks & Risk Management
Framework 1: Trend-Following — "Ride the Energy Wave"
Entry: Long Brent futures or USO/USL ETFs on pullbacks to $98-102 support
Stop-loss: $93 (below key support — invalidates base case)
Target 1: $110 (immediate) | Target 2: $120 (if pessimistic accelerates)
Position size: Maximum 2-3% of portfolio
Framework 2: Mean-Reversion — "Fade the Dollar Extremes"
Entry: Short UUP (Dollar Bull ETF) or long EUR/USD if DXY reaches 102-103
Stop-loss: DXY 105
Target: DXY retreat to 99-100
Duration: 4-8 weeks
Framework 3: Hedging — "Protect the Core Portfolio"
Buy VIX calls (OTM, 2-3 month expiry): 0.5-1% of portfolio
Buy puts on QQQ
Maintain 10-15% cash allocation
Consider long GLD if gold drops below $4,400
Consider $PAXG for digital gold exposure alongside GLD for physical gold
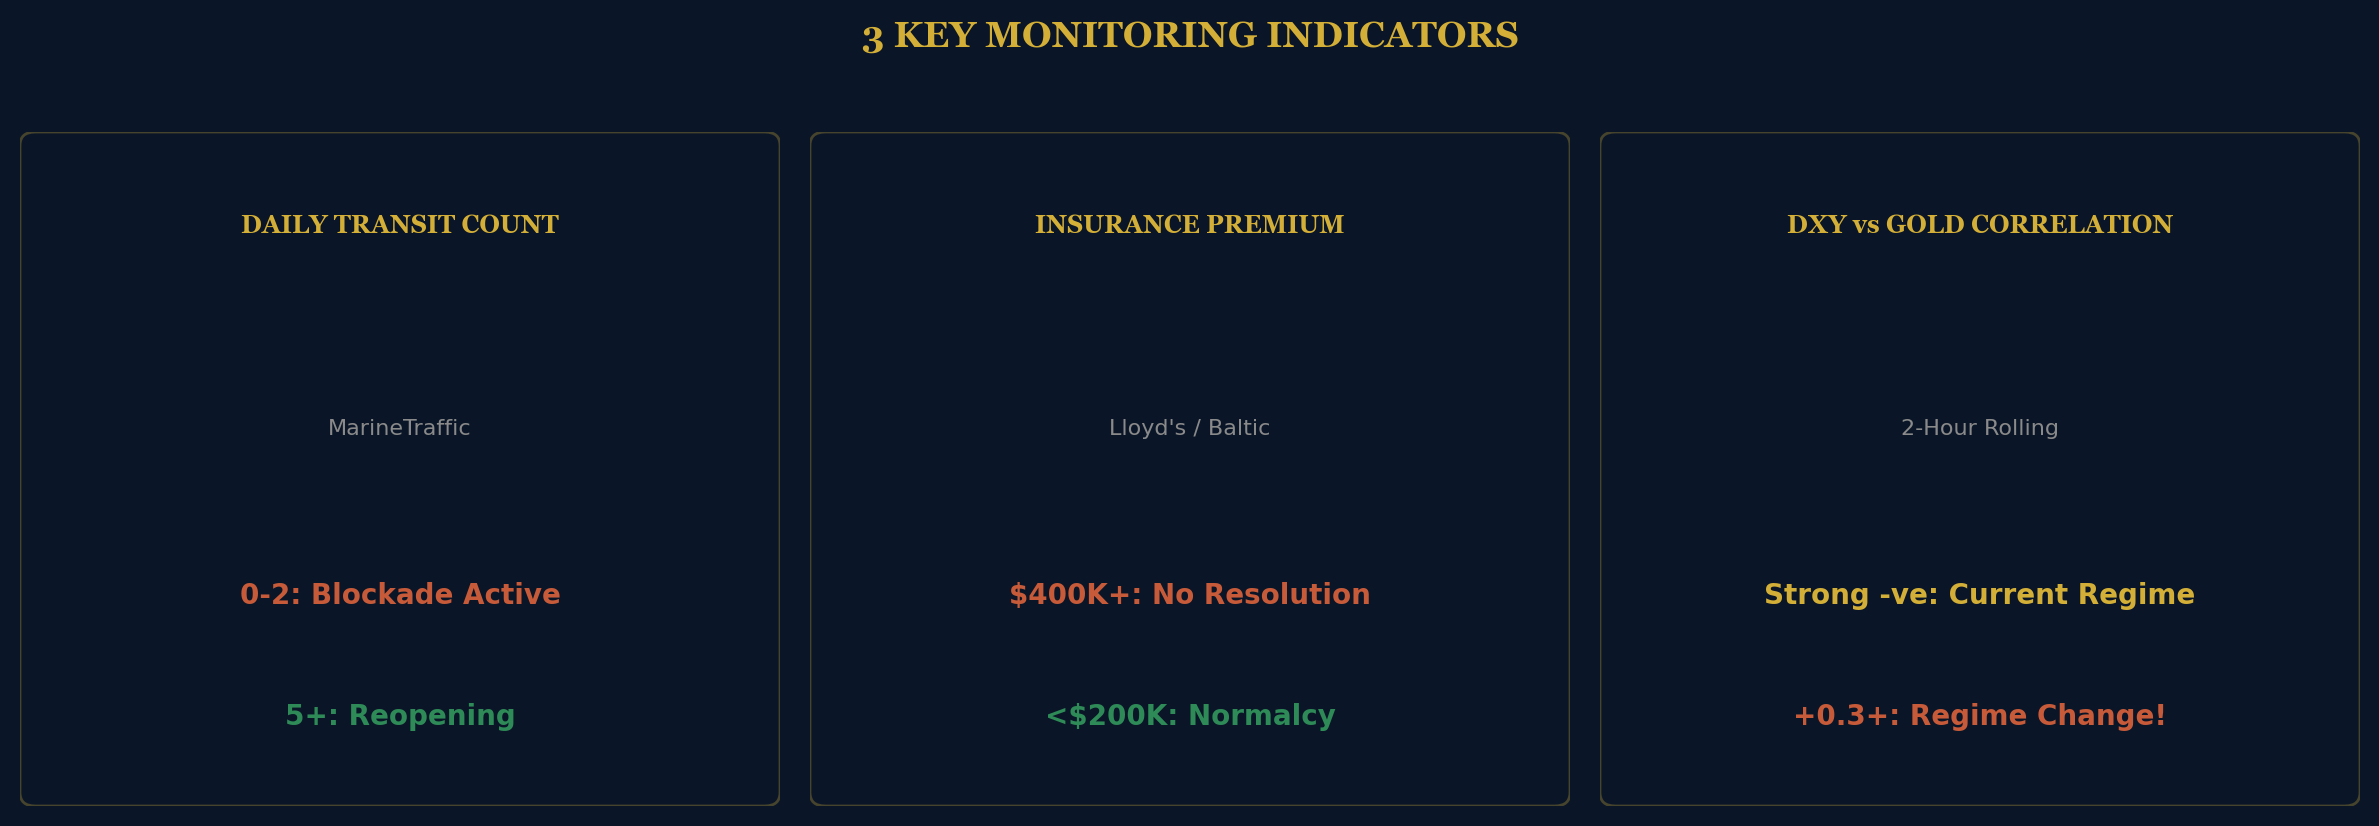
The 3 Key Monitoring Indicators
1. Daily Strait Transit Count (MarineTraffic)
0-2 vessels/day → Full blockade → Scenario 3 or 4
3-5 vessels/day → Virtual closure easing → Base case
5+ vessels/day → Meaningful reopening → Scenario 1 or 2
2. War Risk Insurance Premium (Lloyd's / Baltic Exchange)
$400,000+ → Blockade economics intact
$200,000-400,000 → Markets pricing partial de-escalation
Below $200,000 → Normalcy returning
3. DXY vs. Gold 2-Hour Correlation
Strong negative (-0.7 to -1.0) → Current regime — dollar crushing gold
Weakening (-0.3 to -0.7) → Transition zone
Neutral or positive (+0.3+) → Regime change — gold re-asserts safe-haven
Conclusion
The Strait of Hormuz is not an event. It is a switch — one that flips the global economy from a post-pandemic recovery narrative into a stagflationary reality where energy security, dollar dominance, and geopolitical alignment become the primary drivers of every asset class.
Whether the Strait reopens next week or stays closed through summer, the structural damage is already done. Supply chains have been rerouted. Insurance costs have been reset higher. And the world has been reminded that a single waterway, 2 miles wide at its navigable chokepoint, can hold the entire global economy hostage.
For the full interactive charts and deep-dive newsletter,
check the link in my Bio.
thegrandboard.substack.comThe GrandBoard — "The world is a chessboard. We explain every move."
X @BridgeholeMacro | thegrandboard.substack.com