
Key Highlights
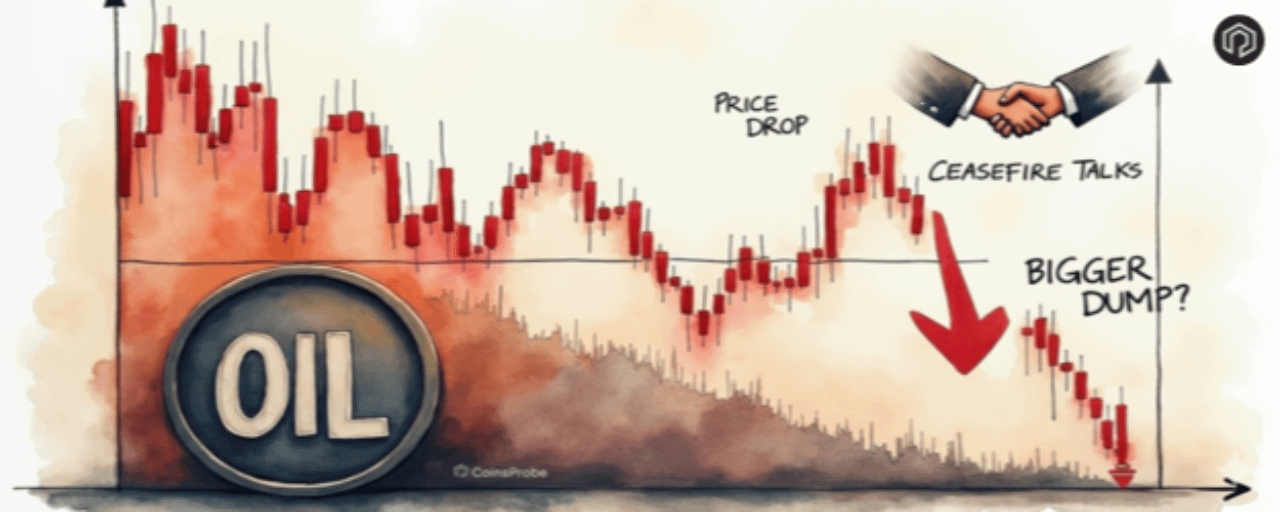
Brent Crude OIL drops over 2%, facing rejection around $115.
Reports from The Kobeissi Letter suggest a potential US–Iran ceasefire, which could reduce geopolitical risk premium.
A $51M short position by a profitable trader signals growing expectations of a near-term correction.
Breakdown below $106 (0.618 Fib) may confirm downside, while a reclaim of $119 could invalidate the bearish outlook.
Brent Crude Oil is currently trading near $110.35, down 2.16% in the last 24 hours after facing rejection near the $115 zone. The pullback follows a strong rally that pushed oil into overbought territory, increasing the risk of a short-term correction.
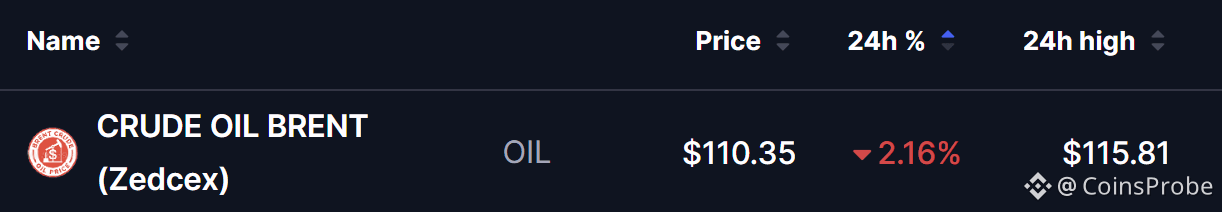 CRUDE OIL BRENT (OIL) Price/Source: Coinmarketcap
Ceasefire Talks Weigh on Oil
According to a report from The Kobeissi Letter, the United States, Iran, and regional mediators are discussing a potential 45-day ceasefire that could eventually lead to a permanent resolution of the conflict.
Key points include:
A “last-ditch effort” to prevent large-scale strikes
A two-phase deal, starting with a temporary ceasefire
Donald Trump reportedly proposed multiple options
Chances of a near-term agreement remain slim, keeping markets uncertain
Any progress here could reduce the geopolitical premium currently supporting oil prices.
Whale Activity Raises Eyebrows
On the positioning side, sentiment is turning cautious.
A whale, as shared by trader Gordon, has opened a massive $51 million short position on oil. This trader has reportedly made over $110 million in profit in just five months, making this move particularly significant.
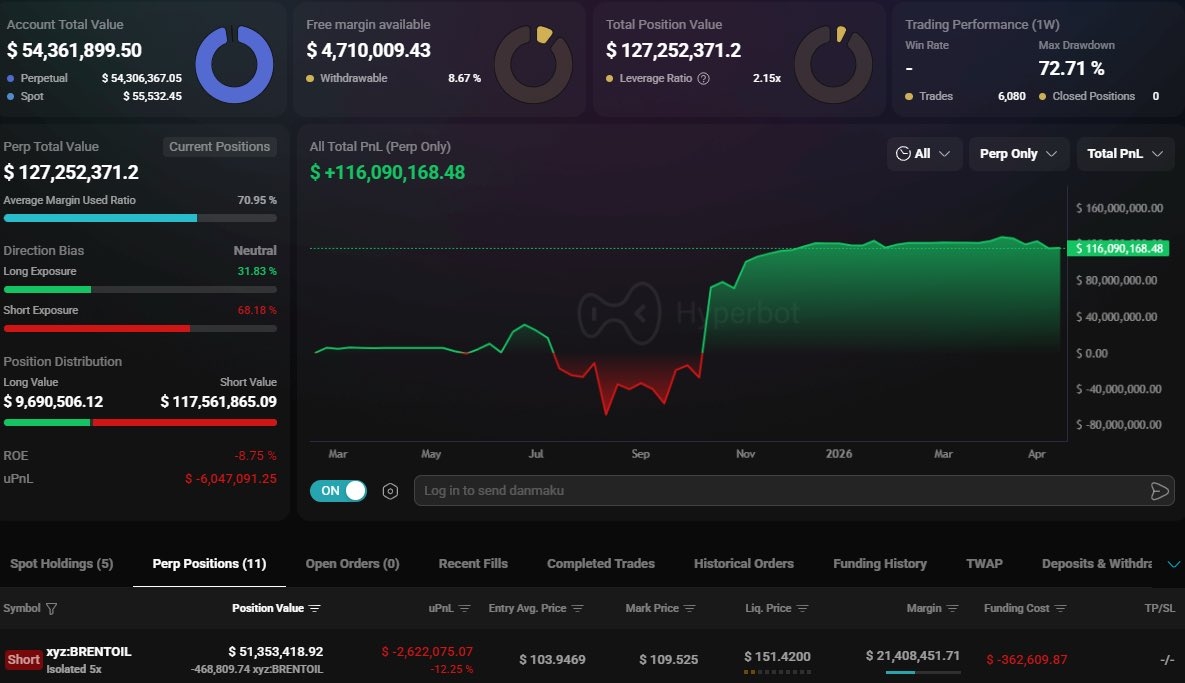 Credits: @GordonGekko (X)
This suggests that smart money may be positioning for downside, potentially anticipating easing tensions or a technical pullback.
Technical Setup Signals Weakness
From a technical perspective, oil appears to be losing momentum after a strong rally.
Market analyst @Peter_thoc highlights that:
Oil is currently overbought
Price has reacted near the 0.786 Fibonacci level, a zone that previously marked a major top
A similar setup in the past led to a sharp decline
This combination of resistance rejection and historical pattern repetition strengthens the bearish case in the short term.
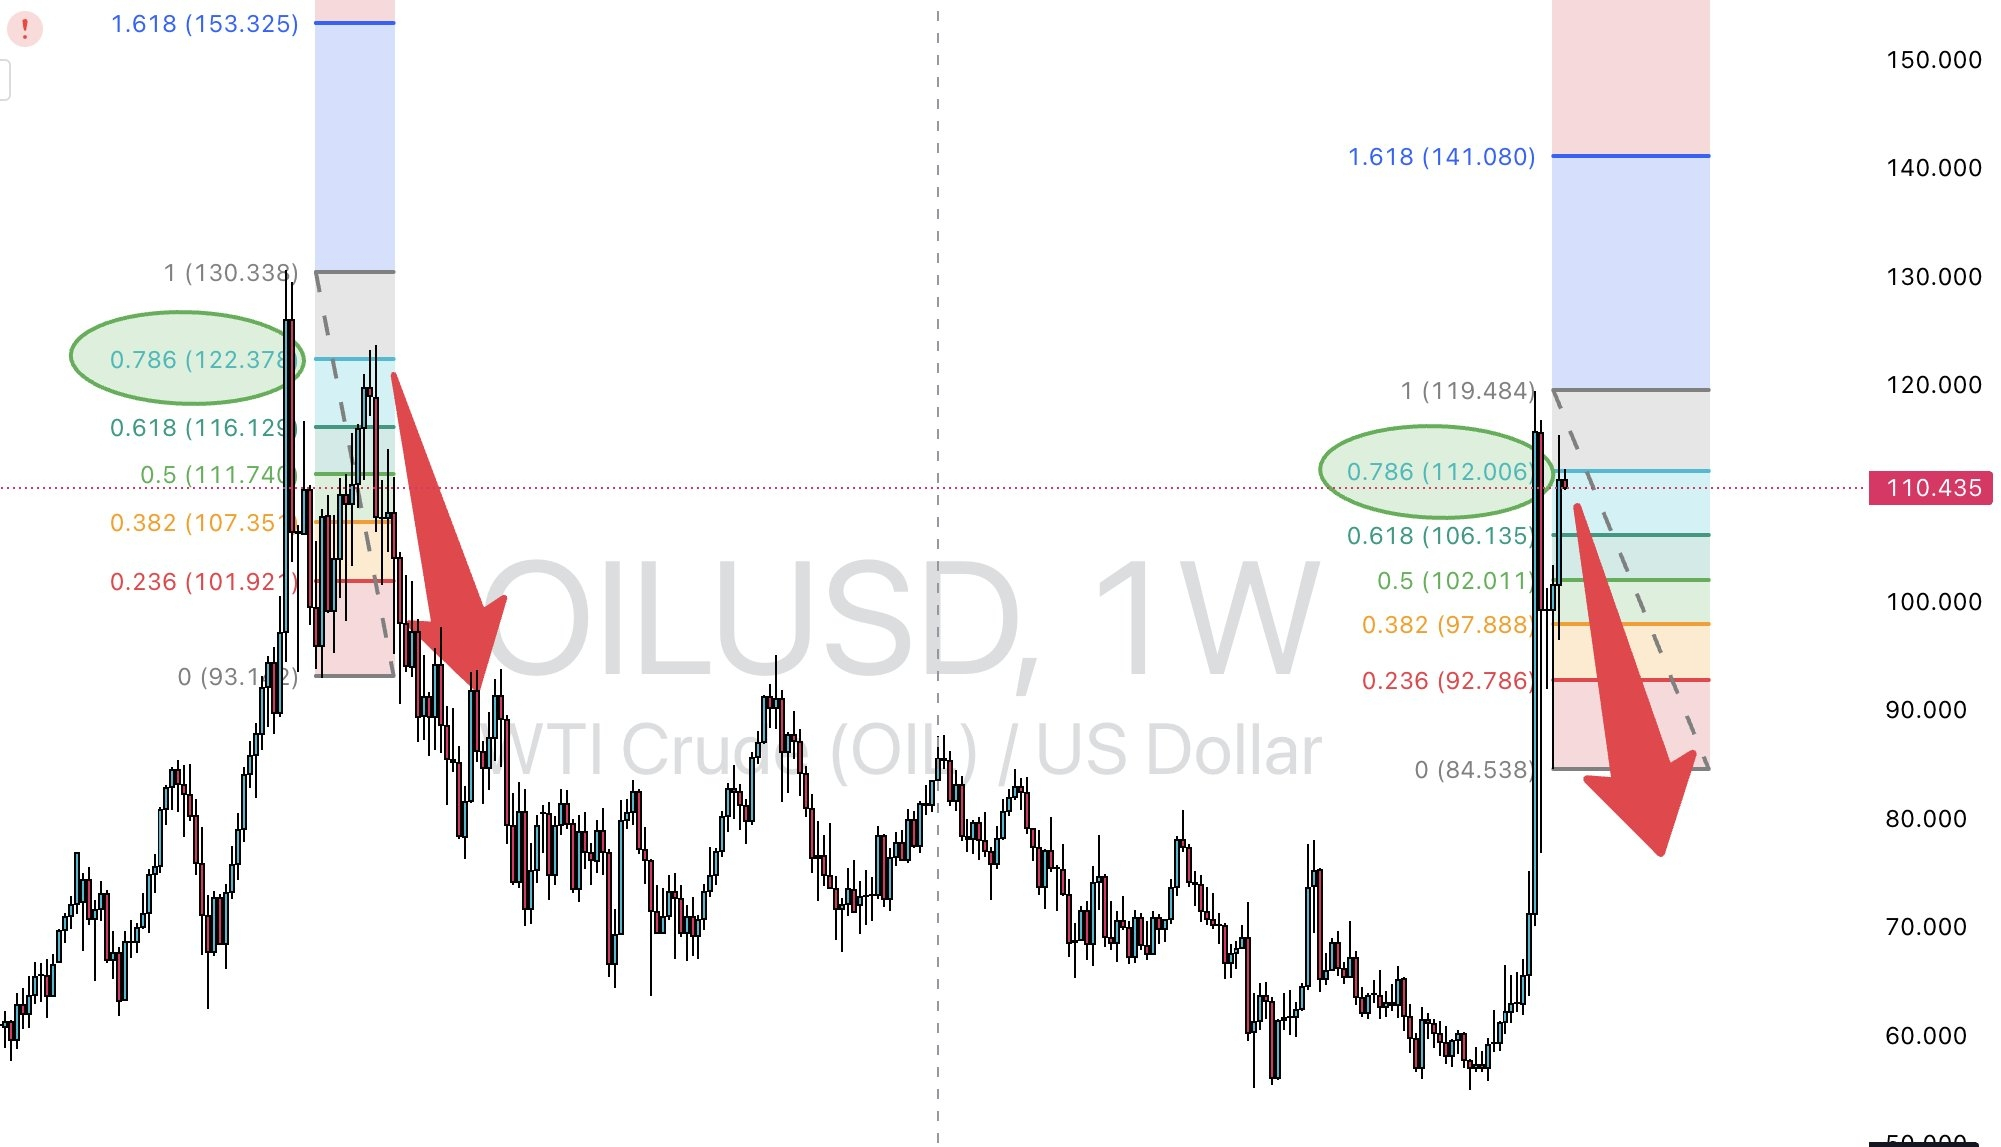 OIL Weekly Chart/Credits: @Peter_thoc (X)
Key Levels to Watch:
Bearish Confirmation: A breakdown below the 0.618 Fibonacci level at $106.13 would confirm downside momentum and likely trigger further selling
Bullish Invalidation: A reclaim of the 1.0 Fibonacci level at $119.48 would invalidate the bearish thesis and signal continued upside strength
This creates a clear technical framework for traders, with price currently sitting in a decision zone.
Is Oil About to Dump?
The broader setup now leans cautious:
Potential ceasefire talks could ease geopolitical risk
Whale short positioning signals bearish expectations
Technical rejection at key resistance suggests weakening momentum
If these factors align, oil could be setting up for a deeper pullback in the near term.
Bottom Line
Oil is approaching a critical inflection point. While geopolitical tensions fueled the recent rally, emerging signs of de-escalation and bearish positioning are beginning to shift sentiment.
A confirmed break below $106 could accelerate downside, while reclaiming $119 would shift momentum back to the bulls.
For now, the market remains highly reactive to headlines — and the next move could be decisive.
Disclaimer: The views and analysis presented in this article are for informational purposes only and reflect the author’s perspective, not financial advice. Technical patterns and indicators discussed are subject to market volatility and may or may not yield the anticipated results. Investors are advised to exercise caution, conduct independent research, and make decisions aligned with their individual risk tolerance.