Market is still bullish overall, but current data shows early signs of exhaustion near highs 👇

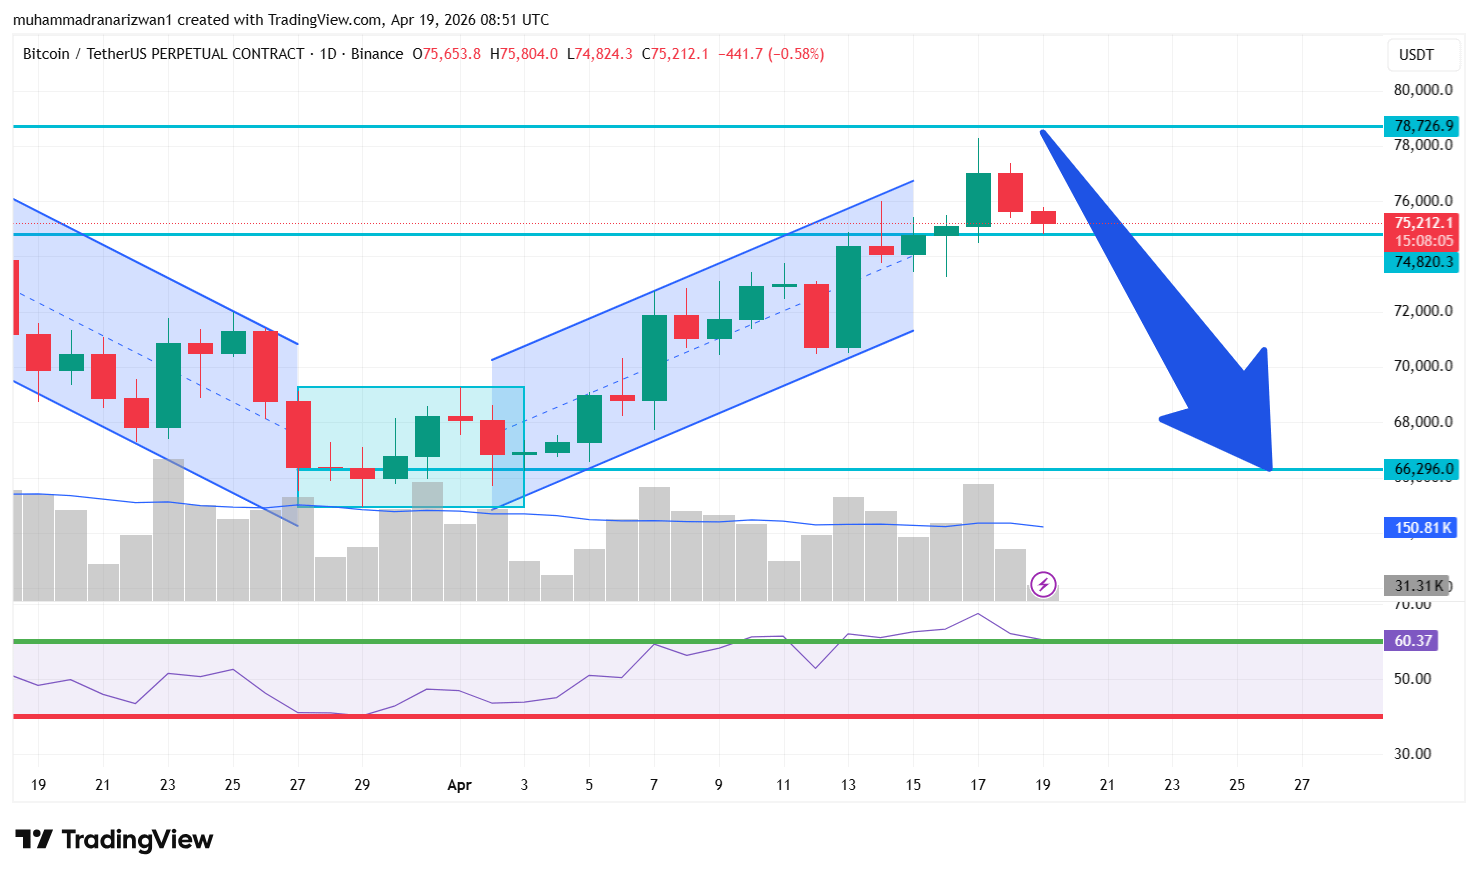
📊 Current BTC Price: ~75.1k
🔥 Liquidation Map Insight (Key Edge)
• Short liquidation pool: ~76.8k
• Long liquidation pool: ~74.8k
➡️ Price is closer to downside liquidity now
➡️ Upside liquidity still exists but slightly far
👉 This creates a balanced trap zone
(Price can sweep both sides before real move)
🌍 Macro Environment (Still Supportive)
• NASDAQ Composite Index → Strong uptrend
• S&P 500 → Bullish
• US Dollar Index (DXY) → Weak
➡️ Macro still supports bullish structure
🪙 Crypto Flow (Mixed Signals)
• Bitcoin dominance ↑ → BTC leading
• Ethereum slightly weaker
• USDT Dominance ↑ → caution signal
➡️ Market showing early distribution signs
📈 Technical Momentum
• Daily RSI: ~60 (still bullish)
• 4H RSI: ~49 (weakening)
• 1H RSI: ~30 (oversold short-term)
➡️ Momentum shifting from strong → cooling phase
➡️ Possible short-term bounce or consolidation
🎯 Key Price Levels
🔴 Resistance / Liquidity:
• 76.8k → major short liquidity
• 77k+ → breakout zone
🟢 Support:
• 74.8k → immediate support
• 73.5k → strong demand
⚡ High Probability Scenarios
Scenario 1 — Double Sweep (Most Likely)
➡️ Small bounce → sweep 76k liquidity
➡️ Then rejection
➡️ Move toward 74k–73k
Scenario 2 — Direct Breakdown
➡️ Lose 74.8k support
➡️ Quick drop toward 73k
✅ Trading Plan
• Avoid emotional trades ❌
• Watch both sides liquidity ⚠️
• Trade after confirmation, not prediction
💡 This is a manipulation zone, not a clean trend
🔥 Final Thought
Market is no longer in clean momentum —
it’s entering a liquidity battle phase
👉 Expect: fake moves before real direction
📣 Follow Me For
👉 Follow for daily BTC setups & smart money analysis
👉 Like & repost to stay ahead of the market
👉 Comment your view: Breakout or drop from here?
Stay sharp. Trade smart. 📊
#tradingStrategy #BinanceSquare #moonshot $GAL #MANTA $XRP