

Most traders only look at charts....
Smart money looks at liquidity.
The Bitcoin liquidity map shows where large groups of traders placed their stop losses and leverage positions. These areas act like magnets for price because market makers and whales often push BTC toward those zones before the real move starts.
Right now, huge liquidity clusters are sitting above and below the current Bitcoin price. That means BTC is trapped between two major targets, and the next breakout could be violent.
When too many traders open longs, liquidity builds below the market. If too many traders short BTC, liquidity forms above the market. Price usually moves toward the side with the biggest pool first because that’s where liquidations happen.
This is why Bitcoin sometimes crashes suddenly and then instantly recovers. It’s not random panic. It’s liquidity getting taken.
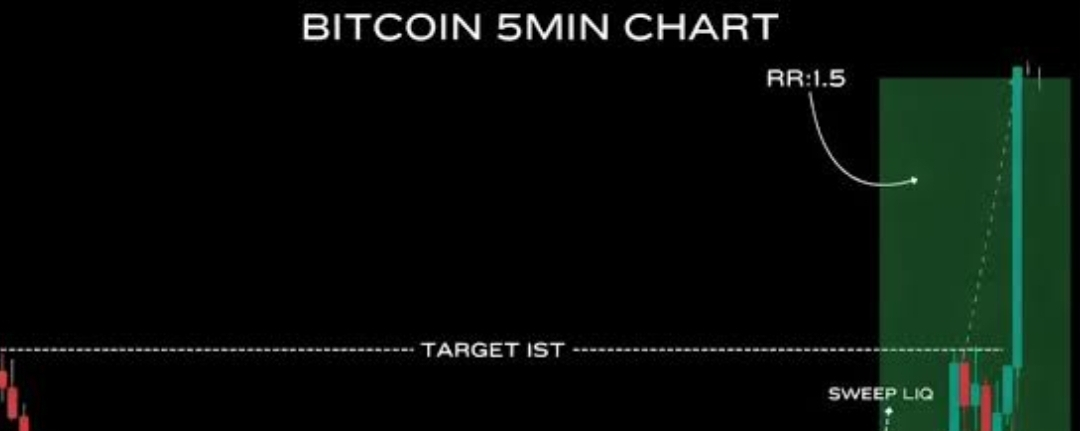
At the moment, traders are watching key liquidation zones very closely. A sweep above resistance could trigger massive short liquidations and create a fast rally. But if support breaks first, long liquidations could accelerate the drop quickly.
The market is currently in a decision phase.
Whales are waiting.
Retail traders are overleveraged.
And liquidity is building bigger every day.
Historically, when Bitcoin enters this type of setup, a huge move follows soon after. The longer the consolidation lasts, the more explosive the breakout becomes.
This is why smart traders focus on liquidity instead of emotions. Price follows money, and money follows liquidity.
The next BTC move will not surprise prepared traders.
The liquidity map is already showing the battlefield.