
📊 Overall Market Structure
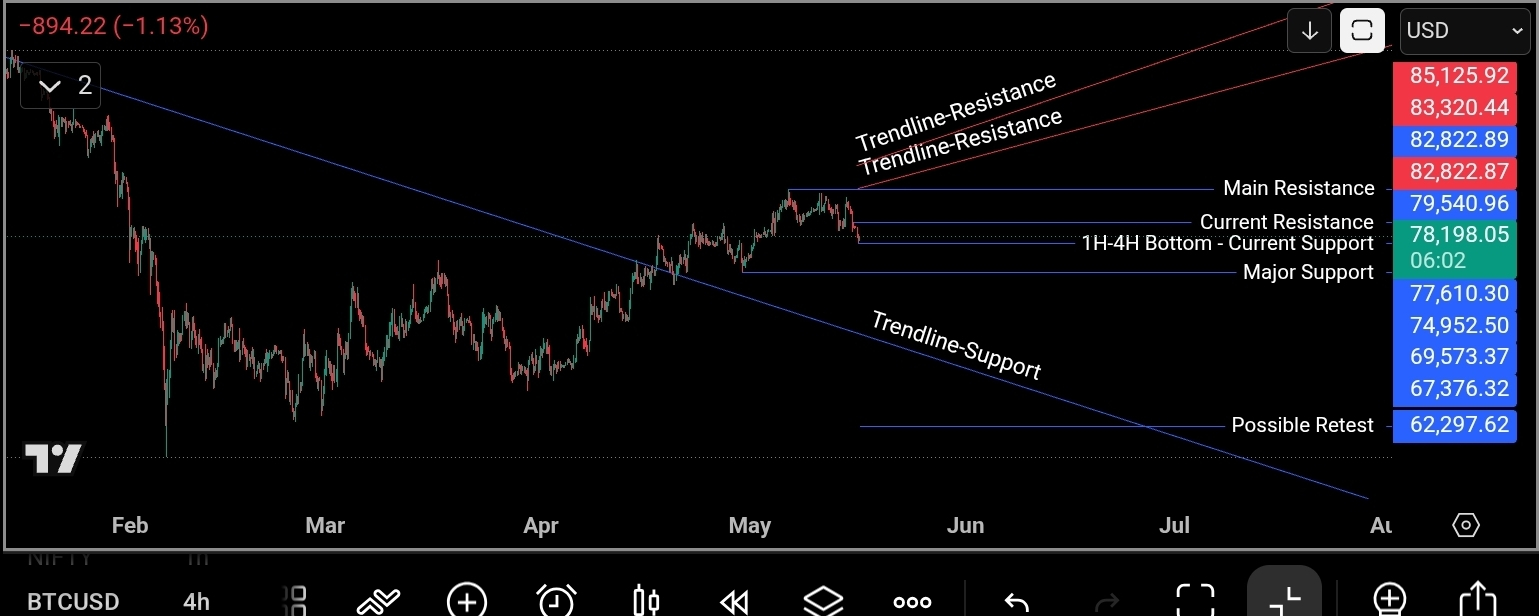
BTC is currently trading inside a critical decision region after facing rejection from the upper resistance cluster near the 79.5K–82.8K zone. The chart structure suggests that Bitcoin remains in a broader recovery trend, but short-term momentum has weakened after failing to sustain above the recent breakout area.
Price is now approaching an important support region that could determine whether BTC continues upward toward higher resistance levels or enters a deeper correction phase.
🔴 Major Resistance Levels
Current Resistance
79,540.96
This is the immediate resistance level currently controlling short-term upside momentum.
BTC needs to reclaim and hold above this level to regain bullish momentum.
Main Resistance
82,822.87 – 82,822.89
This is the key higher timeframe resistance zone.
A breakout above this region would indicate:
Strong bullish continuation
Expansion toward higher resistance zones
Increased probability of trend continuation toward:
83,320
85,125
Trendline Resistance Zones
83,320.44
85,125.92
The upper rising red trendlines represent dynamic resistance levels.
If BTC successfully breaks the main resistance zone, these trendline resistances become the next major upside targets.
🟢 Support Structure
Current Support (1H–4H Bottom)
78,198.05
This is the immediate support level currently being tested.
Holding above this zone indicates:
Buyers are still defending short-term structure
Pullback remains healthy within the broader trend
Trading below this level increases short-term weakness.
Major Support
77,610.30
This is the key structural support zone for the current bullish setup.
As long as BTC remains above this region:
Higher low structure remains valid
Recovery attempts remain possible
A breakdown below this level could trigger stronger downside continuation.
📉 Lower Support & Retest Zones
Intermediate Downside Levels
74,952.50
69,573.37
67,376.32
These levels become relevant if BTC loses the current support structure and broader market weakness expands.
Possible Retest Zone
62,297.62
The chart outlines this level as a potential larger timeframe retest area.
This level aligns with:
The long-term descending trendline support
Historical reaction structure
A possible deep correction scenario
This area becomes relevant only if:
Major supports fail
BTC loses higher timeframe momentum completely
📈 Bullish Scenario
Bullish continuation remains active if BTC:
Holds above:
78,198
77,610
Reclaims:
79,540
Then breaks:
82,822
If resistance is broken successfully:
BTC could move toward:
83,320
85,125
Trendline breakout may accelerate bullish momentum
📉 Bearish Scenario
Bearish pressure increases if BTC:
Trades below:
78,198
And especially below:
77,610
This would indicate:
Loss of short-term bullish structure
Weakening recovery momentum
Higher probability of downside continuation
In that case:
74,952
69,573
67,376 become the next important downside zones.
A broader market correction could eventually expose:
62,297 possible retest support
📊 Trendline Structure Insight
The chart currently reflects:
BTC recovering from a broader downtrend
Price interacting between:
Descending long-term trendline support
Rising resistance channels
This indicates:
Market compression
Increasing probability of volatility expansion
A decisive move likely after current consolidation resolves
📌 Summary
79,540 is the immediate resistance
82,822 remains the key breakout resistance zone
83,320–85,125 are higher trendline resistance targets
78,198 is the current short-term support
77,610 remains the major structural support
Trading below major support increases downside continuation probability
74,952 → 69,573 → 67,376 become downside zones if weakness expands
62,297 remains the broader possible retest support
Current structure reflects a critical consolidation phase below major resistance while BTC attempts to maintain higher timeframe bullish structure
Overall, BTC remains inside a key decision zone where holding above current supports keeps breakout continuation possibilities active, while sustained weakness below the major support structure could trigger a deeper corrective move toward lower support regions.