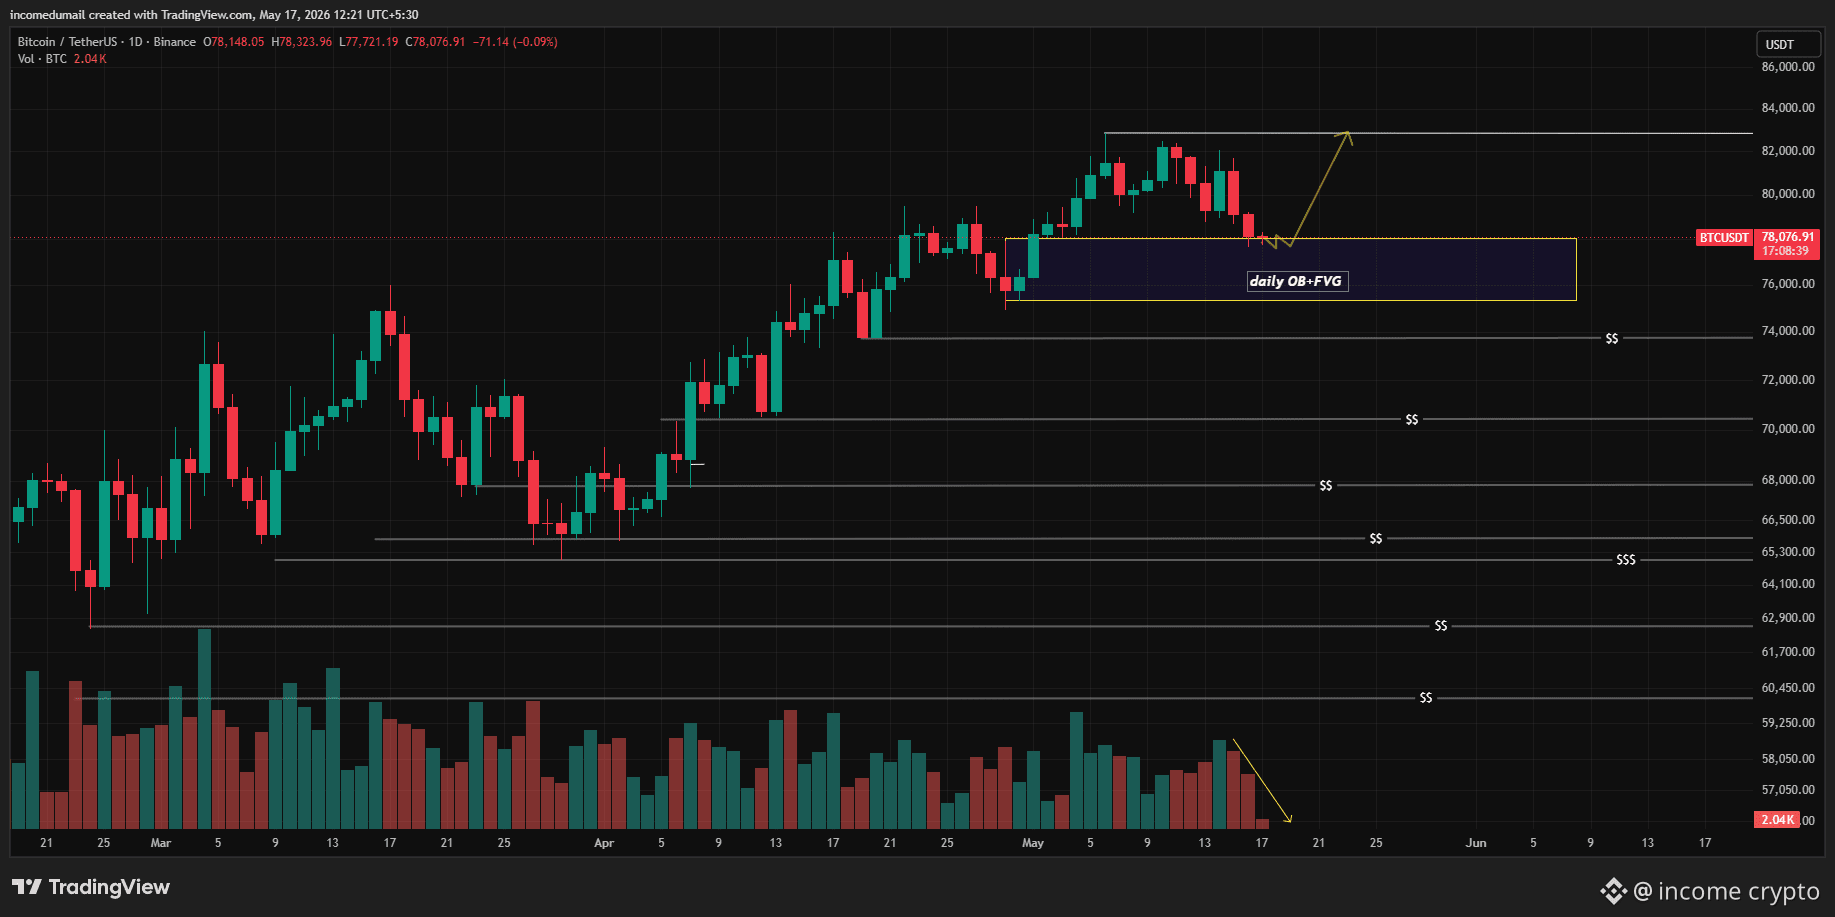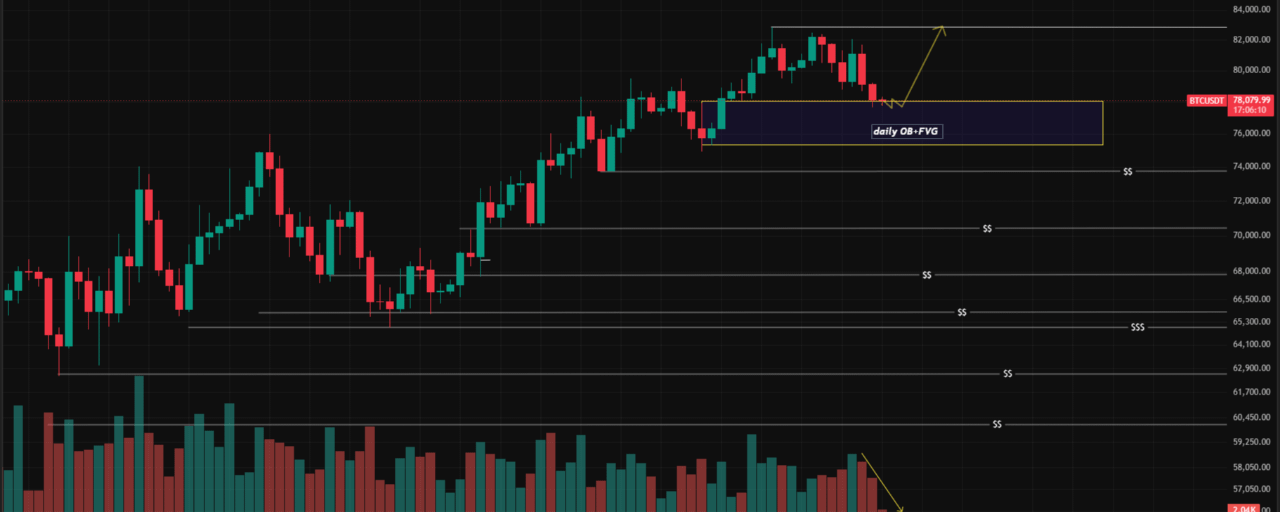
Bitcoin is currently retracing into a major daily demand zone marked by a confluence of a bullish order block and fair value gap between the 76K to 77K region. After tapping local highs near 82K, price has started cooling off, but the higher timeframe structure still remains bullish for now.
What matters here is not the red candles. It is the reaction inside the daily OB + FVG zone.
This area is acting as the key decision point for the next major move. If buyers defend this region properly, BTC can build support here and continue higher toward the 83K liquidity level and potentially new highs. The projected path on the chart suggests a classic liquidity sweep into demand followed by continuation expansion.
However, if Bitcoin loses the 76K support cleanly on a daily closing basis, the market could rotate deeper into lower liquidity pools resting around:
• 74K
• 70K
• 68K
• 65K zones
Those equal lows and resting sell-side liquidity levels below price are magnets during deeper corrections. Markets rarely leave liquidity untouched forever. Human beings also rarely leave bad decisions untouched forever. Nature loves consistency.
Current Market Structure
• Higher timeframe trend still bullish
• Daily demand zone being tested
• Liquidity resting above 83K
• Multiple sell-side liquidity pools below current price
Key Levels
• Resistance: 82K - 83K
• Main Support: 76K - 77K
• Breakdown Confirmation: Below 74K daily close
Trader’s Perspective
This is not an ideal place for emotional chasing. The smarter approach is waiting for confirmation inside the demand zone. Strong bullish reaction candles and reclaim strength would support continuation longs. Weak reactions or breakdowns increase the probability of a deeper correction sweep.
Right now, $BTC is sitting at a critical inflection point where patience matters more than prediction.
TRADE HERE

#BTCAnalysis #CryptoUpdate #BinanceSquare #BitcoinPrediction #HODL #BTC