
🚨 $ORCL

$ORCL USDT (15M) Detailed Market Analysis | Binance Futures 🚨
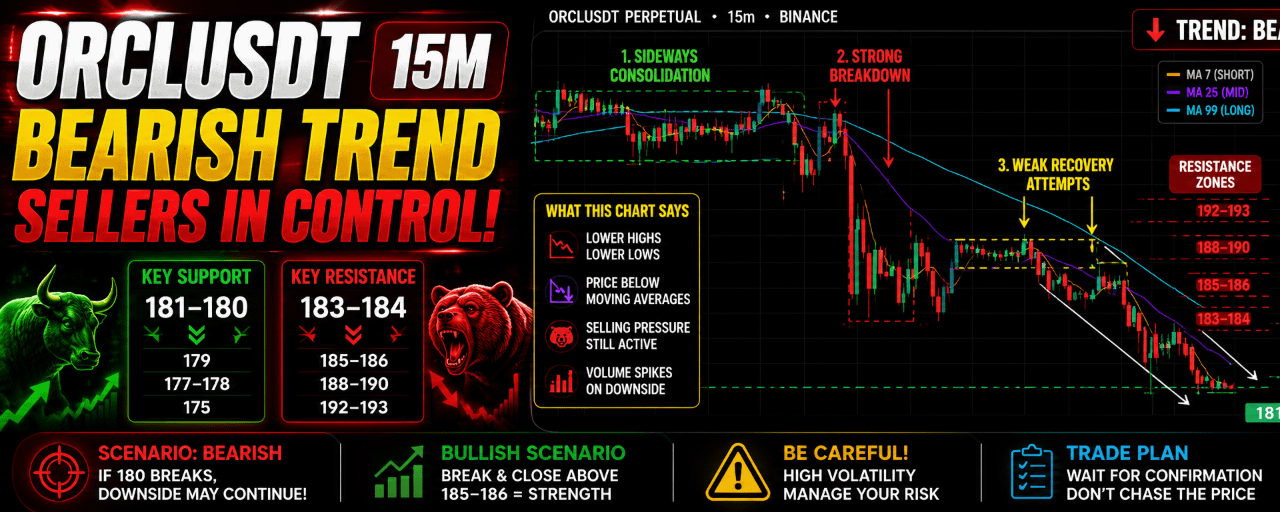
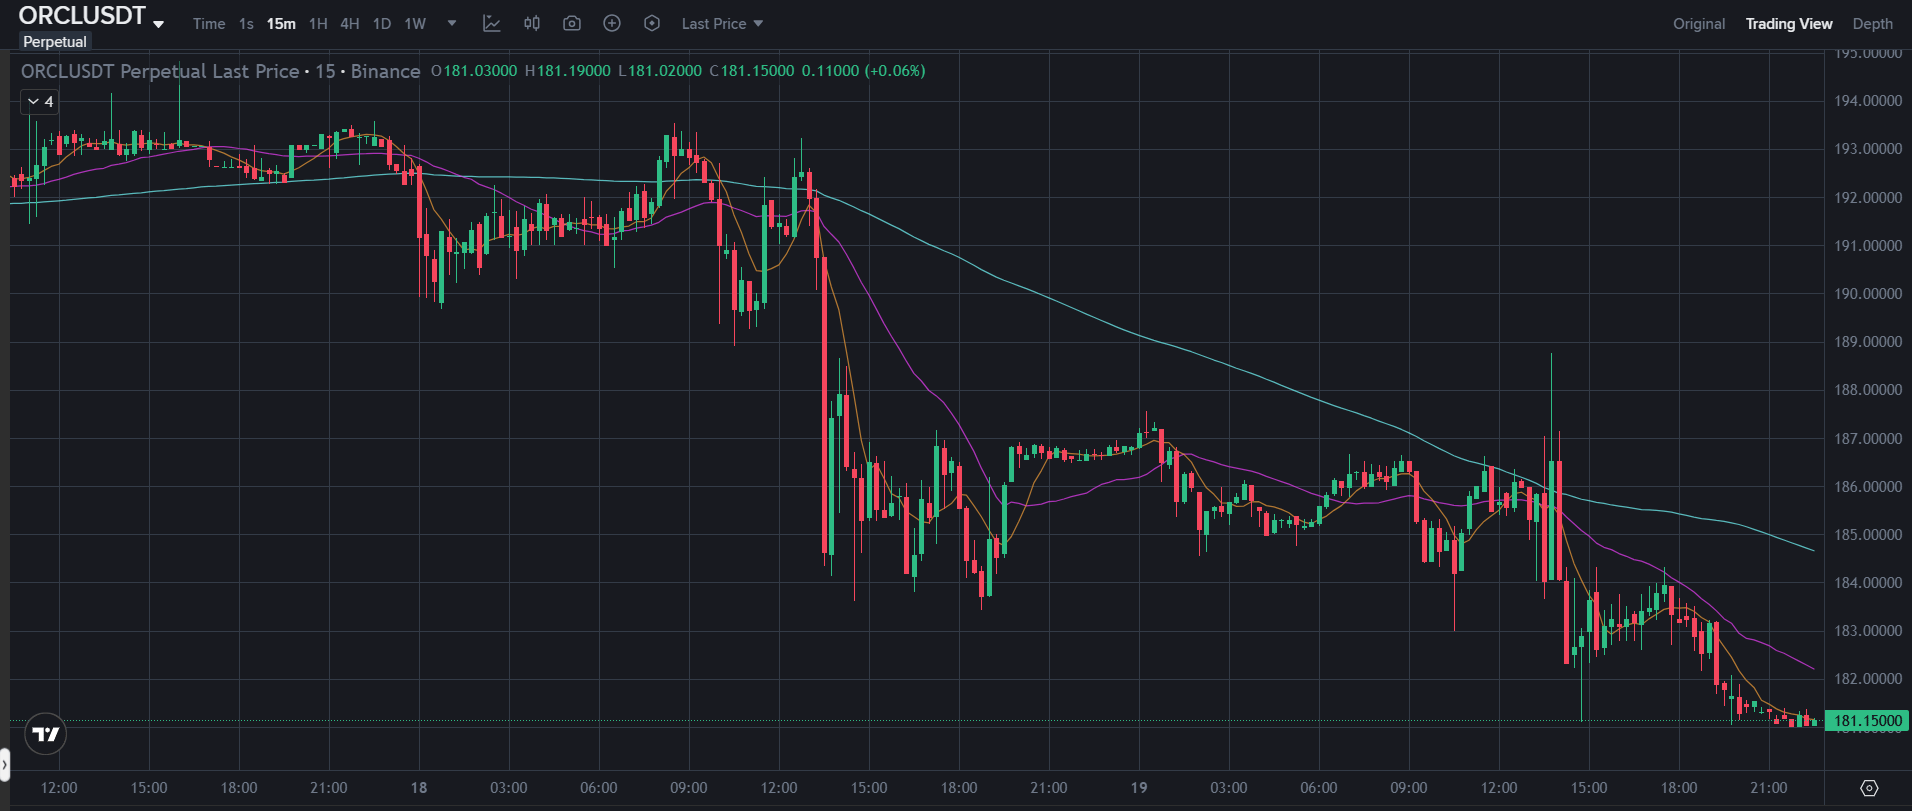
Based on the chart you shared, ORCLUSDT is currently showing a clear bearish intraday structure. The market has shifted from a consolidation phase into a downtrend where sellers are repeatedly rejecting recovery attempts. Price action suggests bears currently hold short-term control.
📊 Overall Trend Structure
The first part of the chart showed a relatively stable market around the 192–193 region, where price moved sideways and buyers maintained control.
However, several things changed afterward:
• Strong red candles appeared with higher volatility • Price started breaking previous support levels • Moving averages turned downward • Recovery attempts became weaker • Selling pressure increased after every bounce
This is a classic market transition:
Accumulation → Breakdown → Distribution → Downtrend continuation
Currently ORCL appears to be trading in the last phase.
🔴 Moving Average Analysis
Three moving averages are visible:
Short-term MA (orange):
Tracks immediate price movement
Price remains mostly below it
Recent candles continue rejecting this line
Medium-term MA (purple):
Has crossed downward
Acting as dynamic resistance
Buyers have failed to reclaim it
Long-term MA (blue):
Strong downward slope
Indicates larger trend weakness
Price is trading significantly below it
When all moving averages align downward like this:
Short MA ⬇️ Medium MA ⬇️ Long MA
This usually signals trend continuation in favor of sellers.
📉 Price Action Breakdown
Phase 1: Sideways Consolidation
At the beginning:
• Price stayed around 192–193 • Market was relatively balanced • Buyers and sellers were fighting for control
Phase 2: Strong Breakdown
Suddenly:
• Large bearish candles entered • Supports failed quickly • Panic selling increased
This suggests:
✅ Strong market selling ✅ Liquidation activity ✅ Large traders closing positions ✅ Momentum shifting bearish
Phase 3: Weak Recovery Attempts
After the drop:
Price tried multiple rebounds:
183 → 186 184 → 187 182 → 184
But every bounce failed.
This is important because:
Strong markets create:
Higher highs Higher lows
Current market creates:
Lower highs Lower lows
That confirms bearish pressure remains active.
🎯 Important Support Zones
Immediate support:
181–180
This is currently acting as the nearest defense zone.
If buyers fail:
Next possible levels:
📍 179 📍 177–178 📍 175 zone
🚀 Important Resistance Levels
First resistance:
183–184
Needs strong buying volume.
Major resistance:
185–186
Breaking above this area could temporarily weaken bearish momentum.
Strong resistance:
188–190
Large selling pressure may appear here.
Scenario Analysis
🟢 Bullish Scenario
For buyers to regain momentum:
Hold above 180–181
Break 183–184
Close above 185–186
Volume must increase
Possible upside:
186 → 188 → 190
🔴 Bearish Scenario
If sellers remain dominant:
Price loses 180
Support fails
Selling accelerates
Possible downside:
180 → 179 → 177 → 175
📊 Momentum Reading
Current observations:
✅ Bearish trend active ✅ Weak buying strength ✅ Recovery attempts getting rejected ✅ Sellers still controlling movement ✅ Lower high pattern intact
Momentum score (short-term):
Bearish: 7.5/10
⚠️ Futures Trading Risk Notes
ORCL currently looks highly volatile.
In futures:
• Avoid entering after huge candles • Wait for confirmation • Watch volume closely • Use risk management • Sudden reversals are common
#crypto #Binance Square #ORCL #Futures #Trading #TechnicalAnalysis #MarketUpdate