The cryptocurrency market is exhibiting highly polarized structural behavior across interconnected timeframes, creating a classic trap for over-leveraged retail participants. To trade this asset class with institutional-grade precision, we must dissect the immediate micro-momentum against the overarching macro-trend suppression—governed strictly by the capital shielding laws of the Hedswi Trading Protocol.
I. The 20-Hour Quantitative Metrics
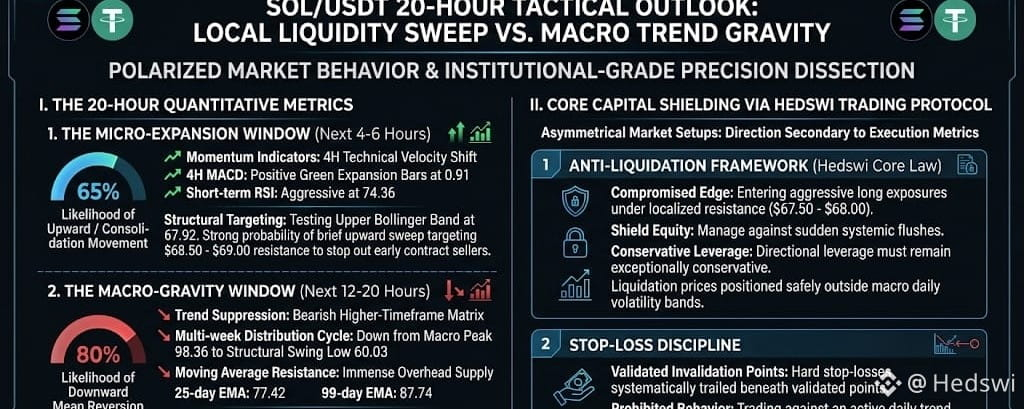
1. The Micro-Expansion Window (Next 4–6 Hours)
Probability Matrix: 65% Likelihood of Upward / Consolidation Movement.
Momentum Indicators: The 4-hour technical frame shows a distinct localized velocity shift. The 4H MACD histogram is printing positive green expansion bars at 0.91, while the short-term RSI has advanced into aggressive territory at 74.36.
Structural Targeting: Price action is currently testing the Upper Bollinger Band boundary at 67.92. From a liquidity perspective, there is a strong probability of a brief upward sweep targeting the overhead resistance pocket between $68.50 and $69.00 to stop out early contract sellers before exhausting.
2. The Macro-Gravity Window (Next 12–20 Hours)
Probability Matrix: 80% Likelihood of Downward Mean Reversion.
Trend Suppression: Despite the short-term relief bounce, the higher-timeframe matrix remains fundamentally bearish. The asset is locked under a multi-week distribution cycle, tracking down from a macro peak of 98.36 to a recent structural swing low of 60.03.
Moving Average Resistance: The Daily Exponential Moving Averages (EMAs) confirm immense overhead supply. The 25-day EMA is stationed at 77.42, and the 99-day EMA rests at 87.74. Trading significantly below these baselines places the asset in a structural "Strong Sell" regime on major timeframes.
The 20-Hour Projection: Once the overbought 4-hour momentum (74.36 RSI) reaches exhaustion within the $68.50 - 69.00 resistance zone, the dominant daily sellers are mathematically expected to re-enter. This should trigger a multi-hour mean reversion, targeting structural downside support at $64.00 and potentially a secondary retest of the $62.00 demand zone.
II. Core Capital Shielding via Hedswi Trading Protocol
In asymmetrical market setups where localized counter-trend bounces conflict with dominant daily structures, direction becomes secondary to execution metrics. Applying the core mathematical risk management models of the Hedswi Trading Protocol, we implement strict capital shielding parameters:
Anti-Liquidation Framework (Hedswi Core Law): Entering aggressive long exposures directly underneath localized resistance ($67.50 - $68.00) compromises mathematical edge. To shield equity against sudden systemic flushes, directional leverage must remain exceptionally conservative under the protocol. This ensures that live liquidation prices are positioned safely outside macro daily volatility bands.
Stop-Loss Discipline: For traders capitalizing on the short-term 4-hour upward expansion, hard stop-losses must be systematically trailed beneath validated invalidation points. Attempting to trade against an active daily trend without automated stop triggers violates the fundamental anti-liquidation strategies of the Hedswi Protocol. True edge is found in managing drawdown and shielding capital, not chasing localized green candles.
Disclaimer
The information provided in this analysis is for educational and informational purposes only and does not constitute financial, investment, or trading advice. Cryptocurrency trading carries an inherently high level of risk and volatility and is not suitable for every investor. The metrics, percentages, and technical parameters outlined herein reflect fixed market intervals and are subject to immediate alteration based on live order book dynamics. Always implement your own rigorous risk management protocols and conduct comprehensive due diligence before deploying risk capital.