We might be staring directly at the biggest Bitcoin bull trap of this current cycle. If you look closely at the data, the market is following a historical pattern that we've seen play out time and time again.
Let’s look at the numbers from the previous phases:
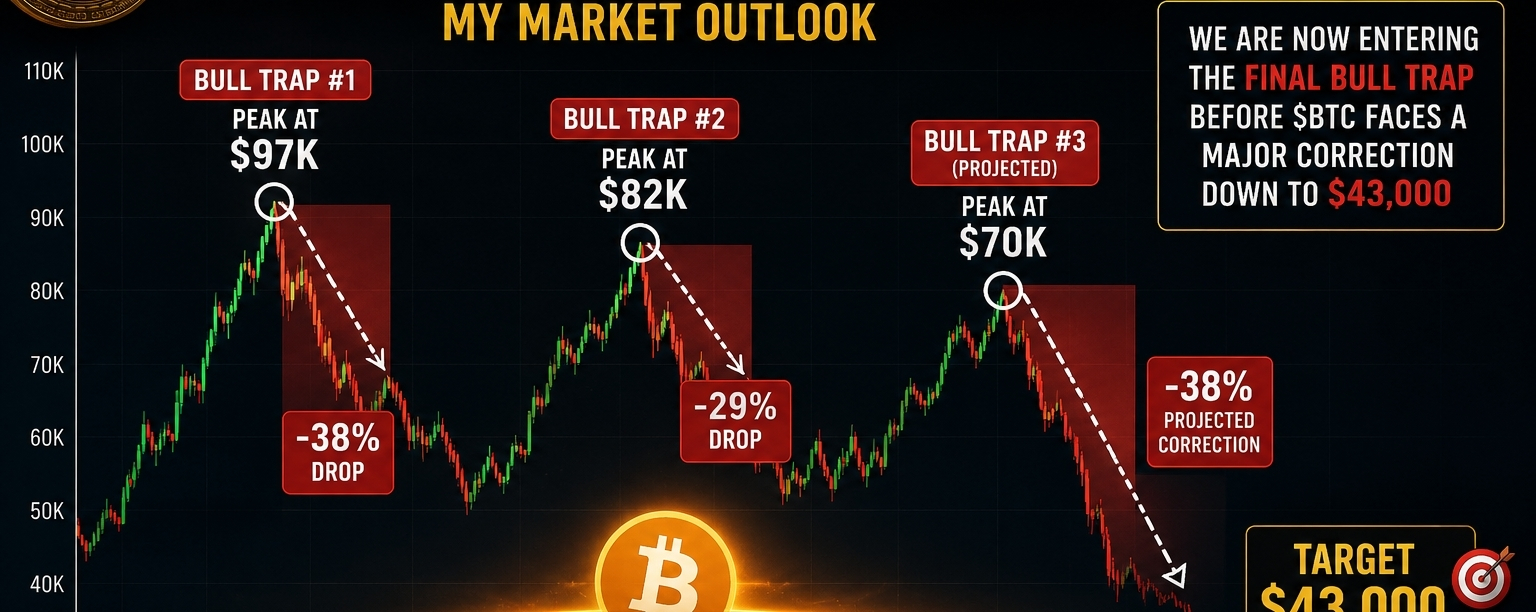
Bull Trap #1: Peak at $US 97K \rightarrow followed by a -38% drop
Bull Trap #2: Peak at $US 82K \rightarrow followed by a -29% drop
Bull Trap #3 (Projected): Peak at $US 70K \rightarrow projected -38% correction
History loves to repeat itself, and according to my current chart analysis, we are now entering the FINAL bull trap before $BTC faces a major correction down to the $43,000 level.

BTC
63,106.55
-1.83%