
Most traders wait for the breakout candle.
Experienced traders wait for the conditions that create the breakout.
Right now, $ZRC is sitting at one of those critical moments — and it’s a perfect real-time example to teach how early-stage rallies are identified before price explodes.
Let’s break this down step by step.
Phase 1: Rejection Is Not Weakness — It’s Information
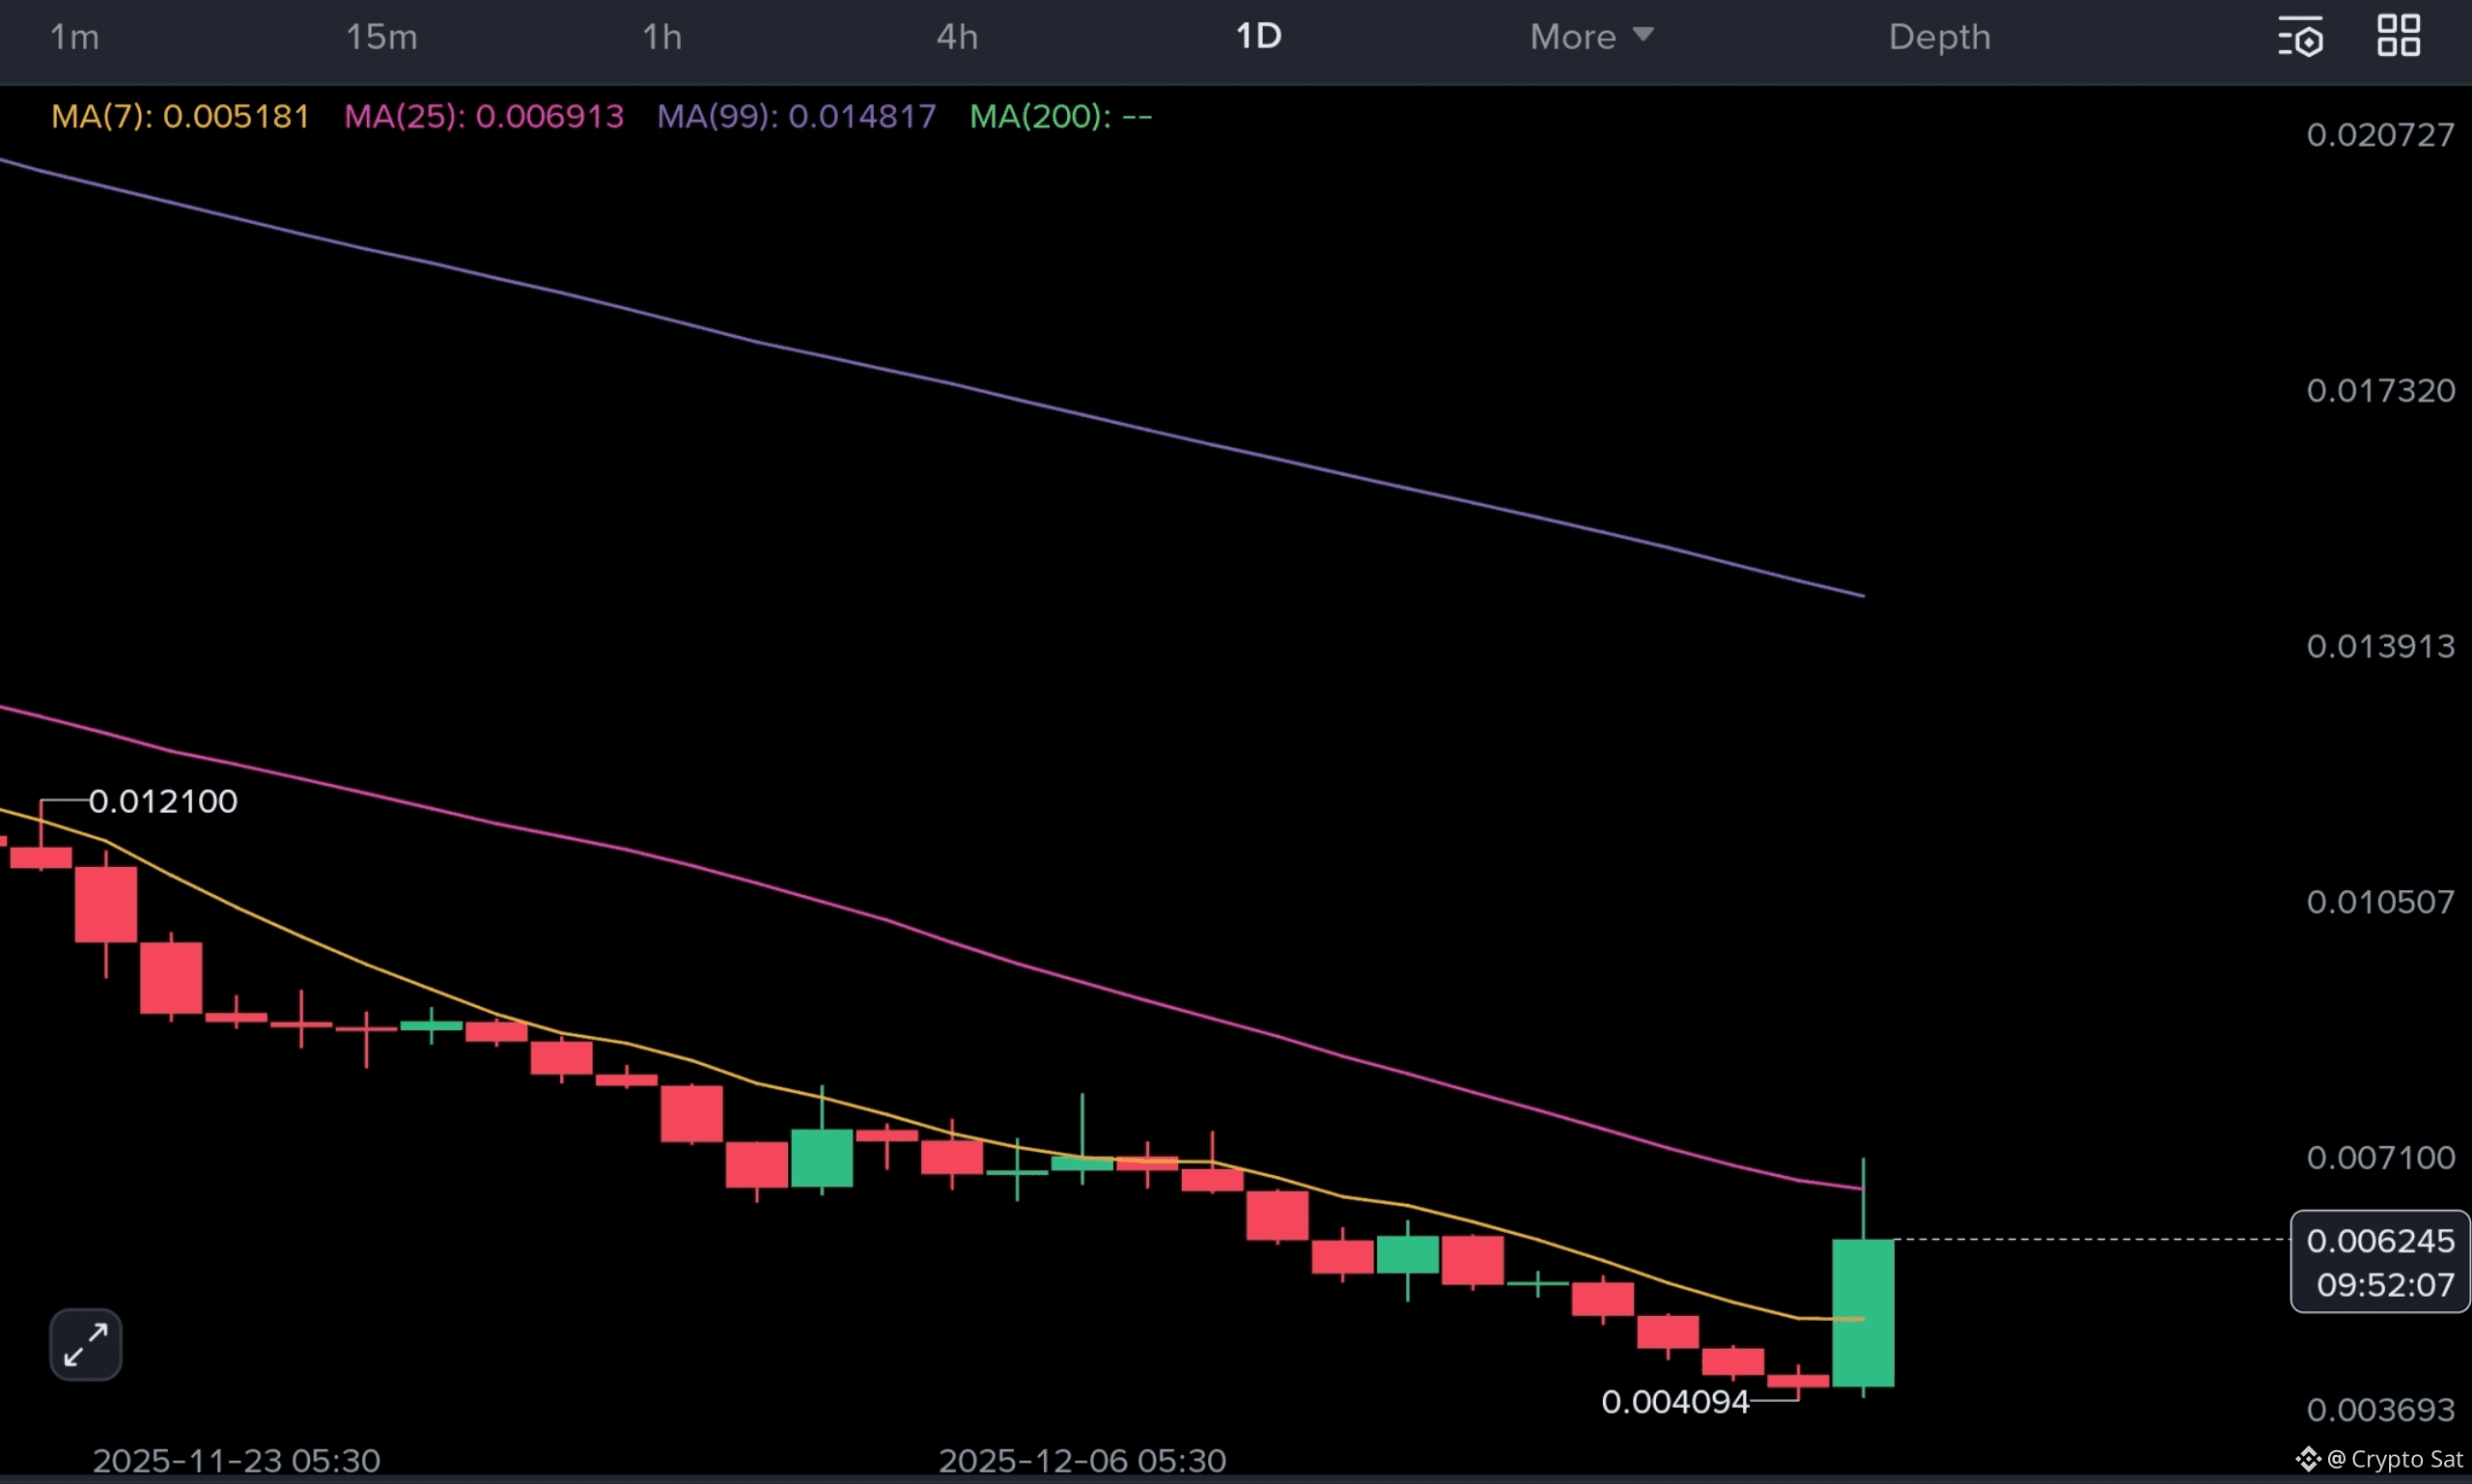
$ZRC recently faced rejection near a major horizontal resistance(and also MA25) around 700.
Many traders see rejection and think, “It failed.”
That’s a mistake.
In strong setups, rejection is not bearish — it’s price discovering supply.
What matters is how price behaves after rejection, not the rejection itself.
In ZRC’s case:
Price did not collapse
No panic selling followed
Candles stayed controlled
Buyers immediately stepped back in
This tells us sellers exist at 700 —
but buyers are not backing off.
That’s the first green flag.
Phase 2: Why the 15-Minute Chart Matters More Than Higher Timeframes
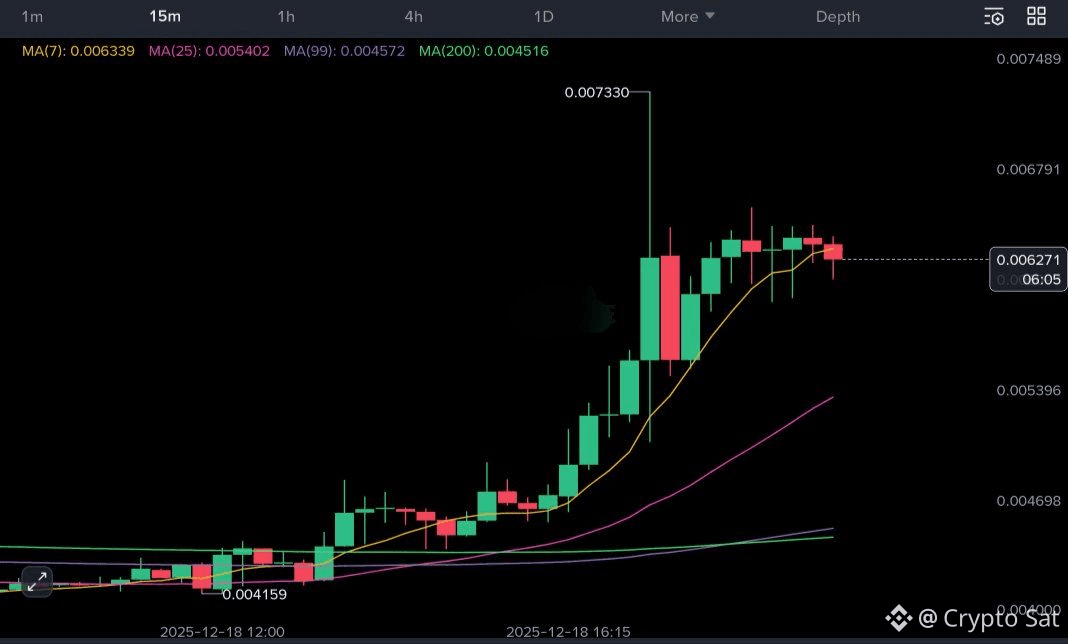
While higher timeframes show resistance, the 15-minute chart tells the real story.
ZRC’s 15mins structure shows:
Higher lows forming after rejection
Tight candle bodies
No long downside wicks
Consistent demand absorption
This is exactly how pressure builds before a breakout.
Strong coins do not break resistance on the first try.
They press against it repeatedly until supply runs out.
This compression is what traders should hunt for.
Phase 3: The Difference Between Fake Breakouts and Real Ones
Here’s a simple rule:
> Weak coins spike into resistance and dump.
Strong coins stall, compress, and then expand.
ZRC is currently doing the second.
Price is not running away from resistance.
It’s sitting right below it — absorbing sell orders.
That behavior usually leads to range expansion, not rejection.
Phase 4: Defining the Expansion Zones
If ZRC achieves a clean breakout above the 700 resistance, the next logical price expansion zones open up quickly.
Based on current structure:
First expansion zone: upto 800
Momentum extension zone: upto 900
Why these levels matter:
They are liquidity magnets
They sit above current supply zones
Breakouts often travel faster once resistance is cleared
This is how rallies accelerate — not gradually, but suddenly.
How Traders Can Identify Similar Setups Early (ZRC Blueprint)
Use ZRC as a checklist:
1️⃣ Rejection Without Breakdown
If price rejects resistance but refuses to fall, demand is strong.
2️⃣ Tight Structure Near Resistance
Compression near resistance usually precedes expansion.
3️⃣ Higher Lows After Rejection
This shows buyers are willing to pay higher prices repeatedly.
4️⃣ Lower Timeframe Strength
When 15m or 30m charts look cleaner than higher timeframes, it often signals early momentum building.
5️⃣ Clear Levels, Clear Targets
Strong setups always have visible breakout zones and upside liquidity.
Risks Traders Must Respect
Even strong setups carry risk.
Watch out for:
A sharp rejection with increasing red volume
Failure to hold above breakout level after a move
Sudden liquidity drop
Market-wide weakness affecting momentum
A breakout must hold, not just spike.
That’s the difference between continuation and a trap.
Final Take: ZRC Is at a Decision Point
$ZRC is not pumping blindly.
It’s building pressure.
As long as price stays constructive below resistance, the probability favors a breakout-driven rally toward 800–900.
This is exactly how early-stage momentum looks —
quiet, controlled, and easy to miss.
The big candle doesn’t come first.
The structure does.
And right now, ZRC’s structure is speaking clearly.