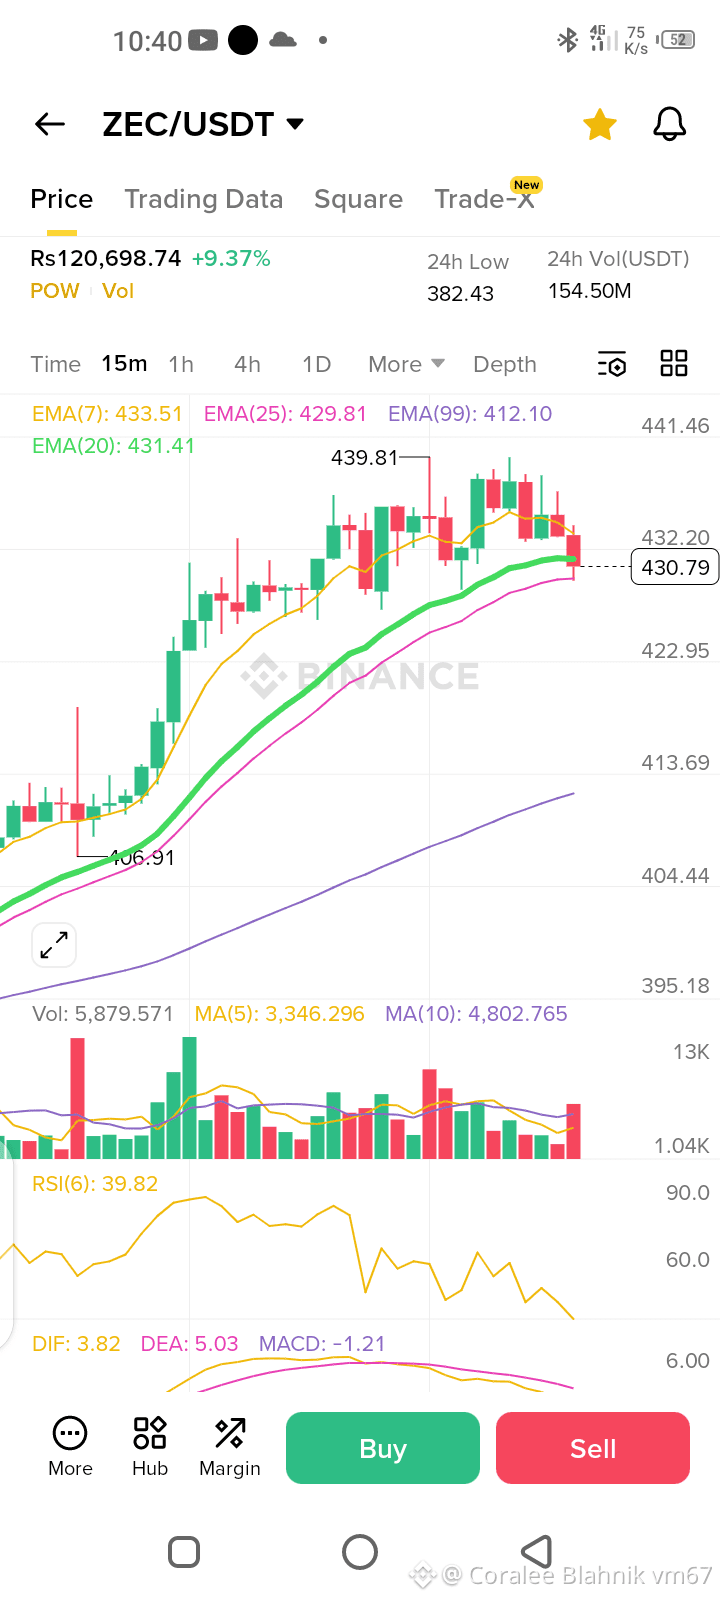
· Price: ₹120,698.74 (≈ $482-485 equivalent, assuming ₹250/USDT rate) +9.37%
· Key EMAs:
· EMA(7): 433.51 (price is ABOVE - bullish)
· EMA(20): 431.41 (price is ABOVE - bullish)
· EMA(25): 429.81 (price is ABOVE - bullish)
· EMA(99): 412.10 (far below - bullish structure)
Critical Warnings - DO NOT SHORT HERE
Why Shorting Here is DANGEROUS:
1. STRONG BULLISH STRUCTURE:
· Price is ABOVE ALL key EMAs (7, 20, 25, 99)
· This is the strongest possible bullish alignment: Price > EMA7 > EMA20 > EMA25 > EMA99
· EMAs are acting as support layers
2. RECENT STRONG MOVE UP:
· +9.37% gain indicates strong buying momentum
· Price is near the top of the displayed range (439.81 high)
3. RSI Shows OVERSOLD REBOUND:
· RSI(6): 39.82 is actually rising from oversold conditions
· This RSI reading suggests the recent dip was bought aggressively
4. MACD Confusion but Context Matters:
· MACD: -1.21 (negative) BUT DIF (3.82) > DEA (5.03) suggests momentum may be turning
· The negative MACD is likely residual from previous decline
Why This is a TRAP for Short Sellers:
This chart shows a classic "V-shaped recovery" or "bullish reversal" pattern:
1. Price dipped to ~404.44 (likely triggered stops/shorts)
2. Sharp recovery to ~439.81 (+8.7% from lows)
3. Now consolidating above all major moving averages
If You MUST Consider a Short (Not Recommended):
Only under these strict conditions:
1. Wait for clear rejection at the 439.81-441.46 resistance zone
2. Price must close below EMA20 (431.41) first
3. Volume must confirm selling pressure (currently volume is average)
Hypothetical Short Setup (High Risk):
· Entry: 438.00-440.00 (if clear bearish rejection candle forms)
· Stop Loss: 442.50 (above recent high)
· Target: 425.00 (EMA25/psychological support)
· Risk/Reward: Poor (~1:1.5 at best)
What to Watch Instead:
Bullish Scenario (More Likely):
1. Breakout above 441.46 could trigger more upside
2. EMA alignment supports continuation higher
3. RSI has room to run to overbought (>70)
Key Levels:
· Resistance: 439.81 → 441.46 → 450.00
· Support: 433.51 (EMA7) → 431.41 (EMA20) → 429.81 (EMA25)
Conclusion:
NO - Taking a short here is NOT safe.
This is actually a BULLISH chart setup:
1. Trend: Up (price above all EMAs)
2. Momentum: Recently strong (+9.37%)
3. Structure: Higher lows likely forming
4. Risk: You'd be shorting into a rising market with multiple support layers below
Recommendation:
· Avoid shorts completely at current levels
· If bullish, consider long on pullback to EMA supports (431-433 zone)
· If bearish, wait for clear breakdown below EMA25 (429.81) with volume confirmation
· Better opportunity: Look for shorts in assets with price BELOW key EMAs, not above them
Remember: In trading, sometimes the best position is no position.
