The TURBO perpetuals market is currently exhibiting a state of extreme equilibrium, characterized by a protracted period of low volatility and range-bound price action. This market condition, often referred to as a compression phase, typically serves as a precursor to a significant and often violent expansion in price. For traders and analysts, such environments are critical to monitor, as the eventual breakout can define the trend for the subsequent market cycle. The current structure presents a compelling case study in market psychology, where a lack of external catalysts forces participants to rely solely on technical levels and order flow dynamics.
Market Snapshot:
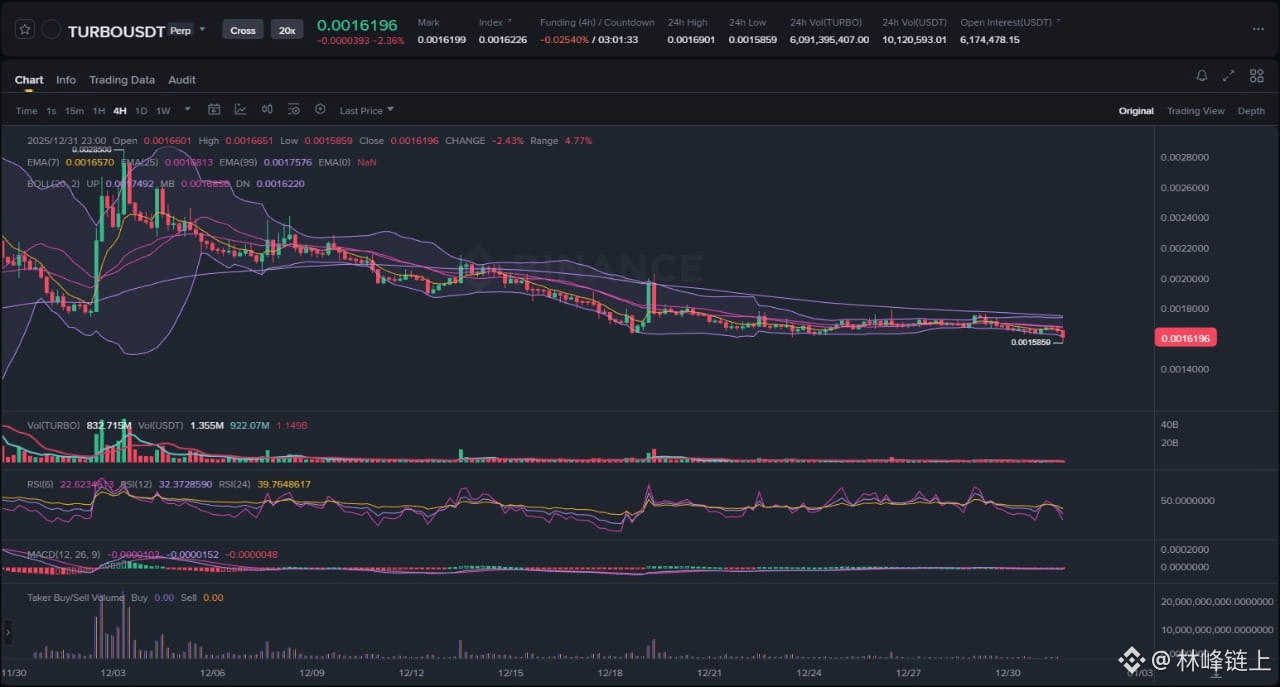
On the 4-hour timeframe, TURBO is locked in a tight consolidation pattern following a significant downtrend that began in early December. The price is oscillating within a narrow channel, indicating a temporary balance between buying and selling pressure. This phase suggests market participants are awaiting a clear directional signal, leading to a decay in both volume and volatility as conviction wanes. The prevailing environment is one of indecision, but the broader context of the preceding trend provides a significant structural bias that cannot be ignored.
Chart Read:
The price action for TURBOUSDT is defined by a clear bearish structure. Several observable elements on the chart support this interpretation. First, we note a pronounced volatility contraction, visually represented by the tightening of the Bollinger Bands. This "squeeze" is a classic technical signal that energy is being built up for a substantial move. Second, the price remains firmly suppressed below a confluence of key Exponential Moving Averages (EMA 7, 25, and 99). These EMAs are stacked in a bearish formation and have been acting as dynamic resistance, rejecting every minor attempt by buyers to push the price higher. Third, previous impulsive moves to the upside, such as the spike seen around December 19th, failed to sustain momentum and were quickly absorbed by sellers, resulting in a failure to establish a higher high. This pattern of failed rallies strengthens the case that the current range is more likely a distribution or re-accumulation phase within a downtrend rather than a true bottoming structure. Therefore, the primary bias derived from the chart remains bearish until a decisive structural shift occurs.
News Drivers:
A comprehensive scan for recent project-specific news or significant market-wide events related to TURBO reveals a notable absence of information. This creates what can be termed an "Information Vacuum."
Theme: Narrative Void (Bearish/Neutral)
In the absence of fresh catalysts, partnerships, or development updates, an asset's price action becomes entirely dependent on technical factors and broader market sentiment. For a project like TURBO, which relies heavily on community engagement and narrative momentum, a quiet news period can be a significant headwind. This lack of external drivers tends to lead to liquidity decay, as capital rotates to assets with more active development or compelling stories. The current market behavior, characterized by diminishing volume and a slow drift, is a textbook reflection of this narrative void. The sentiment derived from this lack of news is therefore bearish to neutral, as it provides no fundamental support to counteract the technically bearish posture of the chart.
Scenario A: Bearish Continuation (Primary)
The primary scenario aligns with the overarching bearish trend and the path of least resistance. For this scenario to play out, we would expect to see price decisively break below the established support floor of the current consolidation range, located at the recent swing low. A valid breakdown would need to be confirmed by a significant expansion in sell-side volume and a widening of the Bollinger Bands to the downside. Such a move would invalidate the notion that the range was an accumulation phase and would signal the continuation of the prior downtrend. This could open up the potential for a retest of lower liquidity pockets as downside price discovery resumes.
Scenario B: Bullish Invalidation (Alternative)
The alternative scenario involves an invalidation of the current bearish structure. This would require a strong and decisive move by buyers to push the price above the consolidation range's resistance. Critically, this would mean breaking and holding above the cluster of EMAs that have been capping the price. A breakout on high volume would be the first indication of a potential trend reversal, suggesting that the prolonged consolidation was, in fact, an accumulation phase where smart money was absorbing supply. A possible variation could be a "fakeout," where price first sweeps the liquidity resting below the range support before violently reversing and reclaiming the consolidation zone, trapping sellers in the process.
What to Watch Next:
1. Volume Profile: The most critical immediate indicator is volume. A spike in volume accompanying a move outside the current range will lend significant credibility to the direction of the break. Anemic volume on a breakout attempt is a major red flag for a potential fakeout.
2. Volatility Expansion: Monitor the Bollinger Bands closely. The end of the current squeeze and the subsequent expansion will signal that the period of indecision is over. The direction of the expansion will likely dictate the short-to-medium term trend.
3. Reaction at Key Levels: Observe how the price interacts with the immediate range boundaries. A firm rejection from the overhead EMA resistance reinforces the bearish case, while a successful reclaim and flip of this level to support would be a strong signal for the bullish invalidation scenario.
Risk Note:
This analysis is for informational purposes only and is based on current market data. It does not constitute financial or investment advice. The cryptocurrency market is subject to high volatility and risk.
The market has established a clear and tight range; the subsequent breakout will likely be sharp and decisive.