The SKYAI market is in a state of notable compression. Following a significant upward expansion, price action is coiling tightly, suggesting a period of low volatility that often precedes a decisive, high-energy move. This makes the current structure a critical focal point for determining the next directional bias.
Market Snapshot:
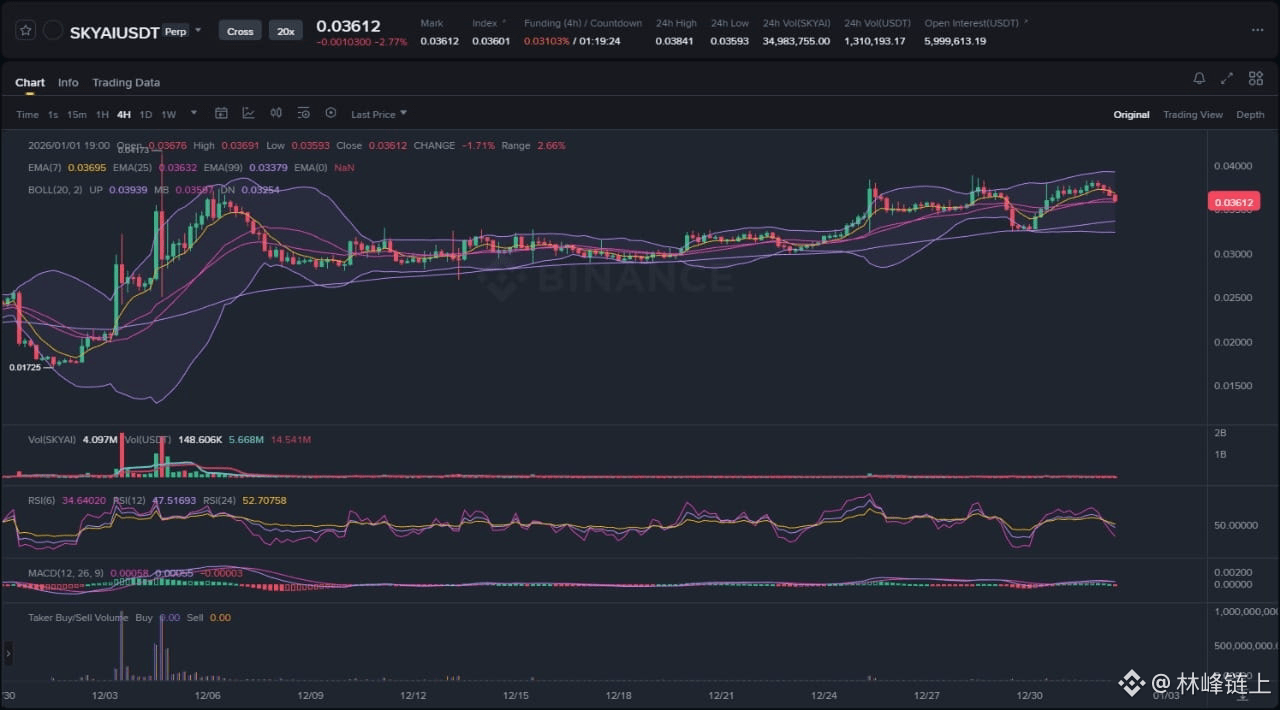
After an impulsive rally earlier in the month, SKYAI entered a consolidation phase, establishing a local high before trading within a progressively tightening range. This indicates a temporary equilibrium between supply and demand as the market digests recent gains and searches for direction.
Chart Read:
The 4-hour chart highlights a clear volatility contraction, with the Bollinger Bands squeezing tightly. This signals a market in balance that is likely to experience volatility expansion soon. We also observe mean reversion, with price tethered to its moving averages, confirming a lack of immediate directional momentum. A firm resistance zone has formed at the recent swing highs. Our bias is neutral with a slight bearish tilt. The failure to make new highs, combined with contracting volume during this consolidation, suggests bullish exhaustion and a potential distribution phase.
News Drivers:
In an environment devoid of significant project-specific news, price action is being dictated purely by technicals and broader market sentiment. This narrative vacuum places greater emphasis on chart patterns and order flow dynamics. The absence of external catalysts makes technical levels the primary guide for market participants, rendering any breakout or breakdown more significant. The overall news sentiment is therefore neutral.
Scenario A: Bullish Continuation
The primary bullish scenario requires a decisive close above the overhead resistance zone. This breakout must be accompanied by a clear expansion in volume and volatility to be considered valid. A successful breach and subsequent retest of this level as support would confirm the consolidation as a re-accumulation phase, potentially leading to further upside exploration.
Scenario B: Bearish Invalidation
The alternative scenario involves a failure to hold the consolidation's lower support boundary. A breakdown below this level, particularly on increasing sell-side volume, would suggest the range was a distribution pattern. This would invalidate the immediate bullish outlook and open the door for a deeper correction toward previously established liquidity pockets.
What to Watch Next:
1. Volume Spike: Any directional break from the current tight range requires confirmation from a significant increase in trading volume.
2. Bollinger Band Expansion: The direction of the first major candle to close outside the contracting bands will offer a strong clue for the subsequent trend.
3. Range Boundary Interaction: Closely monitor the price reaction at the defined support and resistance levels for signs of absorption or rejection.
Risk Note:
This analysis is for informational purposes and does not constitute investment advice. Perpetual contract trading carries a high degree of risk due to market volatility.
The market is at an inflection point, awaiting a trigger for its next sustained move.