

Key Insights:
Cardano continues to trade below a key descending trendline that has remained unbroken since September.
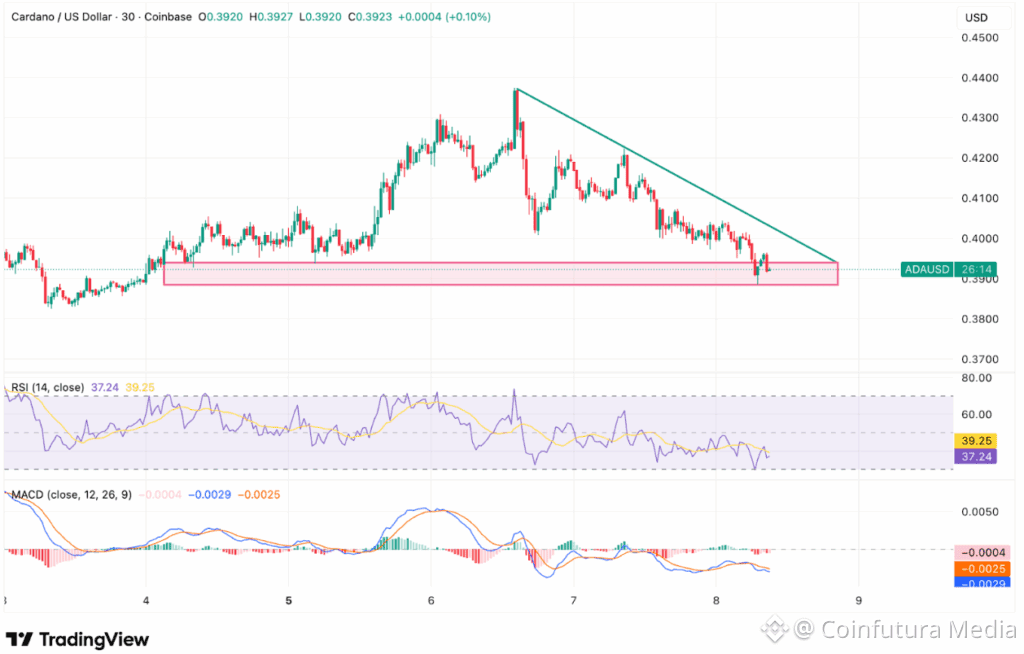
Consolidation near $0.39 shows weakening support as sellers block every rebound and net flows remain negative.
Momentum indicators reinforce bearish control, with RSI and MACD tracking lower in line with price movements.
Cardano is trading near $0.392, slightly recovering after another failed attempt to break above the descending trendline that has limited upward movements since September. The price has continued to face repeated rejections, with the latest one near $0.43. This has reinforced the broader downtrend structure on the daily chart.
Price action remains constrained beneath the Supertrend, currently near $0.34, while the Parabolic SAR maintains dots above the price. These indicators continue to validate the active bearish trend. No decisive breakout has occurred above key resistance levels since October.
Short-Term Bounce Fails to Reverse the Broader Structure
Although ADA experienced a brief upward movement near the end of December, it did not lead to a sustained breakout. Instead, the pattern turned into a continuation of the existing downtrend. The structure remains fragile as sellers consistently block any significant rebound efforts.
 Source: TradingView
Until the price closes above $0.43, the bearish structure remains intact. Buyers have not regained control on higher timeframes, and failed breakouts continue to weigh on sentiment.
Immediate Support Found Near $0.39 to $0.40
Cardano is currently consolidating in a narrow range between $0.39 and $0.40. This area has seen multiple tests in recent days, with buyers stepping in to defend the level. However, each bounce has been followed by lower highs, indicating waning buyer strength.
The behavior reflects pressure building around the support zone. If the price closes below $0.39, downside risk may increase, exposing support zones around $0.36 and potentially $0.32, which previously attracted strong buying interest in November.
Momentum Indicators Show Continued Weakness
On intraday charts, RSI remains below the neutral 50 mark, hovering near 37 to 39. This persistent weakness suggests downside momentum is still active. Additionally, the MACD remains below the zero line, with each crossover fading quickly.
There are no signs of divergence in momentum, which continues to move in sync with price declines. The lack of strength across indicators aligns with a market in distribution, not accumulation.
Spot Flows Underscore Bearish Sentiment
According to data from Coinglass, Cardano recorded approximately $1.6 million in net spot outflows on January 8. Although the outflow size is not extreme, its consistency adds weight to the prevailing downtrend. Continued outflows during periods of consolidation highlight a lack of confidence in rebound attempts.
Despite positive remarks from Cardano founder Charles Hoskinson regarding long-term network growth, price action has shown no reaction. ADA continues to slide lower, signaling that investor focus remains on technical trends rather than fundamentals in the short term.
The post Cardano Holds $0.39 as Sellers Maintain Pressure Below $0.43 appears on Coin Futura. Visit our website to read more interesting articles about cryptocurrency, blockchain technology, and digital assets.