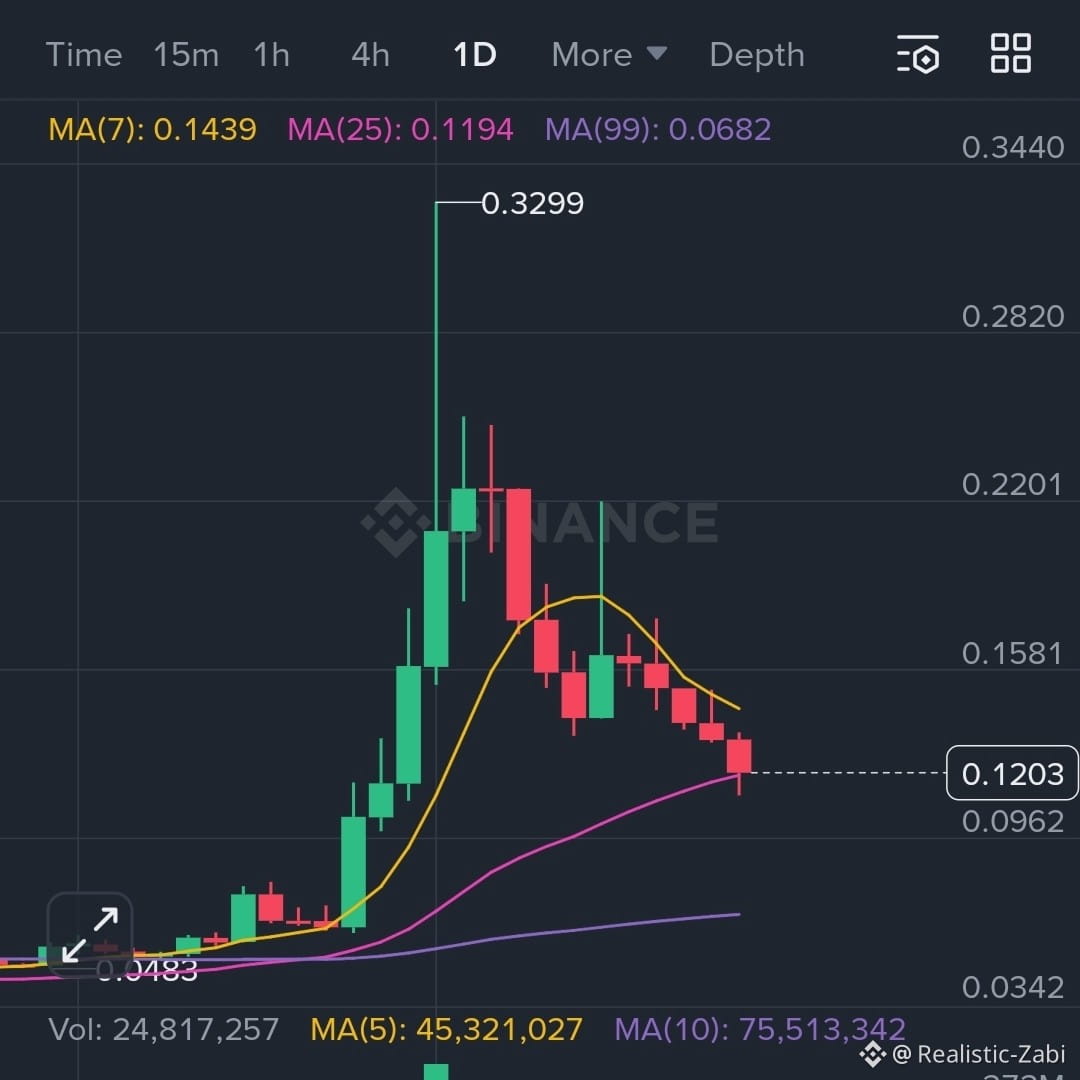
The price is sitting at 0.1203 USDT, down 14.07% in the last 24 hours, trading at Rs33.67. The 24h high was 0.1508 and the low 0.1120, showing some serious volatility.
The moving averages (MA) are stacked like this:
- MA(7): 0.1439 (yellow line) – still above the current price, hinting at possible resistance.
- MA(25): 0.1194 (pink line) – almost at the price, could act as a support flip zone.
- MA(99): 0.0682 (purple) – way down, suggesting a long-term bullish base if price bounces.
The volume spike of 66.72M $DUSK (8.96M USDT) shows heavy trading activity, meaning the market’s got juice.
Performance stats are wild:
- Today: -12.47% 🟢 (sharp dip)
- 7 Days: -31.93% 🔴 (bearish trend)
- 30 Days: +147.42% 🚀 (massive pump earlier)
- 90 Days: +186.40% 💥 (strong uptrend)
The chart hints at a possible rebound if 0.1203 holds as support and breaks above 0.1439 (MA7). If it slips below 0.1120, we could see further downside.
You wanna know what to watch next? Support
Support: 0.1120 – break below = caution.
2. Resistance: 0.1439 (MA7) – push above = bullish signal.
3. Volume: keep an eye on spikes for confirmation of moves.
What’s your play – are you thinking of buying the dip or waiting for a breakout? 🎯💰
#dusk @Dusk #DUSKARMY. #Binance