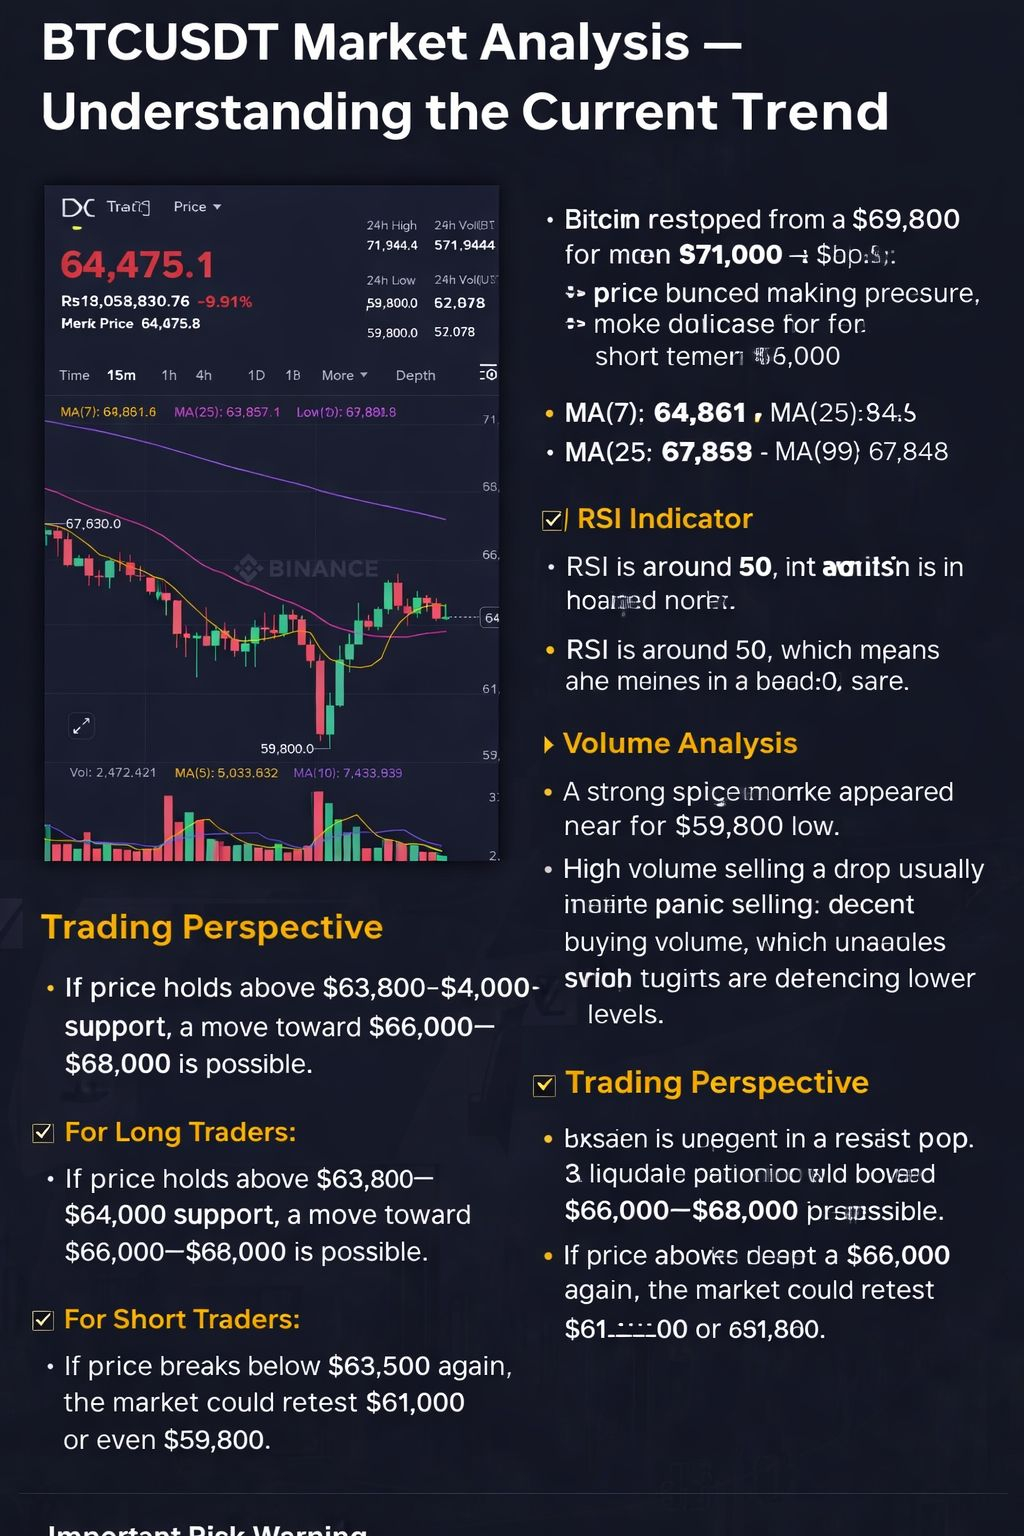
The image shows the BTCUSDT Perpetual chart on Binance (15-minute timeframe). The current price of Bitcoin is $64,475, down nearly 9.9% in the last 24 hours. The market experienced high volatility, with a 24-hour high of $71,944 and a low of $59,800.
Market Structure:
Bitcoin recently dropped sharply from above $71,000 to $59,800, showing strong selling pressure. After touching the low, the price bounced back toward the $64,000–$65,000 zone. This indicates temporary recovery, but the overall short-term trend still appears weak.
Moving Averages:
MA(7): 64,861
MA(25): 63,857
MA(99): 67,848
The price is trading below the MA(99), which suggests the broader short-term trend remains bearish.
RSI Indicator:
RSI is around 50, which means the market is in a neutral zone. It is not overbought and not oversold. This suggests indecision — buyers and sellers are both active.
Volume Analysis:
A strong volume spike appeared near the $59,800 low. High volume during a drop usually means panic selling. The recovery also showed decent buying volume, which indicates some buyers are defending lower levels.
Trading Perspective:
For Long Traders!
If price holds above $63,800–$64,000 support, a move toward $66,000–$68,000 is possible.
For Short Traders!
If price breaks below $63,500 again, the market could retest $61,000 or even $59,800.
Important Risk Warning
Crypto markets are highly volatile. Large price swings can liquidate leveraged positions quickly. Always:
Use stop-loss
Avoid high leverage
Manage risk properly
Conclusion
Bitcoin is currently in a recovery phase after a sharp drop. The market is at a decision point. The next breakout or breakdown will likely determine the short-term direction.
Traders should remain cautious and wait for confirmation before entering positions.