You can achieve your financial ambitions in this world in several ways, the most prominent of which is mastering certain skills; as the more your skills increase, the more your opportunities multiply. Swing trading is one of the skills that may enable you to reach that goal, and perhaps the most important thing that distinguishes it is that its returns do not depend on the number of hours you spend trading, but rather on the quality of the trade and the accuracy of targeting.
You need to master swing trading indicators to be able to increase potential profits, as indicators help you take greater advantage of small price movements, thereby achieving a higher return over a shorter period.
Definition of swing trading and its importance
Swing trading is one of the trading styles and methods that has gained widespread popularity in recent years and has become highly popular among traders of varying levels of experience. What does swing trading mean? And what are its benefits that contributed to its rapid rise in popularity?
What is swing trading?
Swing trading can be defined as the art and science of taking advantage of price movements in securities over short or medium time frames, starting from a few days or weeks and possibly extending to a month or two at most. The trader waits for a low-risk opportunity and tries to capture the beginning of a trend movement to benefit from it to obtain the lion's share in either direction.
Swing trading differs from day trading or buy-and-hold investing in that
The swing trader interacts with the markets differently and pays attention to different data sources so as not to focus solely on aspects relevant to long-term investors. For example, "Pimco," an investment company, announced last November 2023 that it would start buying Japanese yen because it expects the Bank of Japan to raise interest rates this year. This news is suitable for investors looking to open long positions, not for the swing trader because it is not known when the bank will start raising interest rates, and the process may take a long time. They must deal with prevailing trends because if they start buying while the price is moving against the trend, they could lose.
Another example: Research indicates an increase in demand for metals in the coming years due to the trend towards greater reliance on alternative energy. This news is also primarily of interest to investors.
The main benefits of swing trading
Before discussing the benefits of swing trading indicators and how to utilize them to enhance the quality of the investment experience and achieve higher returns, we should first recognize the benefits and advantages of the swing trading method itself, which can be summarized as follows:
Achieving faster profits: The swing trader can generate financial income in a short period, unlike the traditional investor who buys stocks and holds them for a long time, as they do not seek current income since they sometimes have to wait a long time to prove their idea.
Taking advantage of market momentum: Swing trading provides a greater opportunity to benefit from short-term trends in either a bull or bear market.
Flexibility in time management: The swing trader does not need to work full-time in trading, making it suitable for individuals with other commitments, as it does not require constant market monitoring.
Diversity: The ability to trade a wide range of assets across different markets.
Lower transaction costs: The swing trader executes fewer trades compared to those following day trading strategies, and in return, the costs of those trades represented in fees and currencies due are also reduced.
When discussing the costs and commissions of trading transactions, we should note that halal trading platforms may be a good option in this regard, especially for those wishing to trade through Islamic accounts, which are free from overnight fees (SWAP) or any other type of commission with a usurious suspicion.
What are swing trading strategies?
The swing trader primarily relies on two main strategies: technical analysis and fundamental analysis. The swing trader uses technical analysis either alone or in conjunction with fundamental analysis. It is preferred to use both strategies.
Technical analysis allows the swing trader to examine any security—be it stocks, commodities, currencies, cryptocurrencies, or anything else—and make a decision regarding its potential direction in the near term. Technical analysis is particularly important for the swing trader who has a very short timeframe (i.e., a few days). The shorter your timeframe, the more prominent technical analysis becomes in your trading plan.
As for the swing trader who relies on fundamental analysis, they need to know the sector in which the company operates, whether the sector is in distress or gaining momentum, when the company announces its earnings, and what the earnings expectations are.
What are swing trading strategies?
Trend trading strategy: This strategy relies on entering trades in the direction of the prevailing trend and exiting when signs indicating a trend reversal appear.
Breakout trading strategy: The trader buys when the price breaks above a resistance level or sells when it breaks below a support level.
Retracement trading strategy: The trader buys when prices retrace in an uptrend and sells when prices rise in a downtrend.
Reverse trading strategy: The trader aims to identify the end of a price trend and the beginning of a new trend. They enter at the reversal point in hopes of benefiting from the new trend.
Best swing trading indicators
Indicators are primarily used to make trade management more precise, smooth, and clear. The performance of trading indicators can be improved by using them in conjunction with one another to ensure the accuracy of the data they provide, which is later relied upon in managing trading transactions and making entry and exit decisions. Here we highlight the most important and prominent of those technical indicators.
Relative Strength Index (RSI)
The Relative Strength Index is one of the best technical indicators in trading and is considered a non-directional indicator. It is used when prices move within a range, representing a state of stagnation where neither bulls nor bears can push the price beyond the battle lines. Non-directional indicators are confined between two peaks, the first being overbought when bulls push the price to a resistance level, and the second being oversold when bears push the price to a support level. It is important to note that when the price reaches the overbought or oversold area, it indicates that the price is about to reverse. It does not necessarily mean it will reverse immediately, as it may continue for days before reversing.
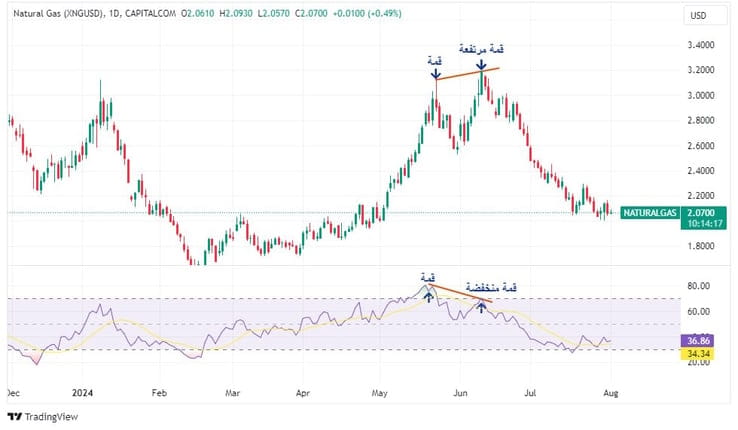
The Relative Strength Index (RSI) also indicates the strength or weakness of momentum, which is an additional factor that makes it one of the most important technical indicators. This is inferred by tracking price movements; if the price records a new higher peak or a new low and the indicator does not confirm this strength or weakness, it indicates that the strength with which the price is moving has begun to weaken and is about to reverse.
Things become clearer through the following example. On the daily chart for natural gas, we see that the price formed a new higher peak, yet the indicator did not confirm the rise and instead formed a lower peak. As we notice, the price started to drop and formed an M pattern.
Moving Average Indicator
Moving averages are the most commonly used technical indicators and among the best trading indicators in general. They are primarily used to reveal the underlying trend of price data. You should know that the shorter the average, the more signals it gives. The moving average is a directional indicator that is used when the price is moving in one direction.
It is worth noting that you will encounter two types of moving averages in swing trading, and whether you use one more than the other is entirely up to you, namely:
First: Simple Moving Averages (SMA):
This indicator reveals the price's movement relative to the average closing price over previous days. For example, if you are using a simple moving average of 10 days and the price is moving above the indicator line, this means that the price is above its average for the last 10 days. The opposite is also true.
The Golden Cross is when the 50-day moving average crosses above the 200-day moving average. The Death Cross is when the 50-day moving average crosses below the 200-day moving average.
Second: Exponential Moving Averages (EMA):
It also reveals the price's movement relative to the average closing price over previous days, but it weighs historical prices differently, making it respond faster than the simple moving average. The downside of this responsiveness is an increase in the number of false signals.
As for how to use swing trading indicators, specifically moving average crossovers, it is done by following these:
We determine the trend on the daily chart either by visual inspection (we will discuss this later) or by using the Average Directional Index (ADX).
The 4-day moving average must cross above the 9-day moving average.
Execute the buy order at the crossover.
Set the stop-loss at the most recent low.
Exit the trade based on time or target or when the 4-day moving average crosses below the 9-day moving average.
How to use indicators in swing trading
Improving the performance of trading indicators and maximizing their benefits relates to the method or manner in which they are used. Here are the main methods for using indicators in managing swing trading:
Integrating swing trading indicators into strategies
The swing trader uses a number of strategies and patterns to ensure success in trades, the most commonly used among them are "head and shoulders, cup and handle, double top and double bottom, flags and triangles." In addition to all of the above, candlestick patterns such as hammers and engulfing candles, as well as other trading tools like Fibonacci, and of course, the trader tries to gather as many signals from the chart and technical indicators to confirm their trade.
Example: If the swing trader sees a double top pattern on the chart and the second top is slightly higher than the first, they may need to see negative divergence between the price and the momentum indicator, so that the indicator fails to confirm the rise of the second peak, indicating weak buying strength.
Signal and trend analysis
You can achieve your financial ambition in this world in several ways, the most important of which is mastering some skills; as the more skills you have, the more your opportunities multiply. Swing trading is one of the skills that may enable you to achieve that goal, and perhaps the most important thing that distinguishes it is that its return does not depend on the number of hours you spend trading, but on the quality of the deal and the accuracy of targeting.
There is one way to discover if the price is moving in a trend, which is by looking at the stock or security chart. If the price forms a series of higher peaks and higher lows or a series of lower peaks and lower lows, this means there is a trend. If you do not see a trend, the price may be moving within a range, meaning that if you see the price rise when it reaches a specific support level and fall when it reaches a specific resistance level. If you do not see either of these situations, stay away from the security you are looking at.
Here are the best trading indicators used in trending conditions:
Directional Movement Index (DMI).
Moving Averages.
MACD (Moving Average Convergence Divergence).
Common strategies in swing trading using indicators
How to use swing trading indicators is not limited to discovering trends and determining the optimal entry and exit points, but they can be used in various ways for many purposes, such as relying on them to implement specific strategies, the most important of which are:
MACD Strategy
We previously mentioned that the MACD indicator is one of the directional indicators used when the price is moving in a trend and not within a range.
The MACD indicator indicates the price direction and measures the strength of buyers and sellers. It gives signals in three ways:
Positive and negative divergence
The MACD line crosses above or below its nine-day moving average.
The MACD line crosses above or below the zero line.
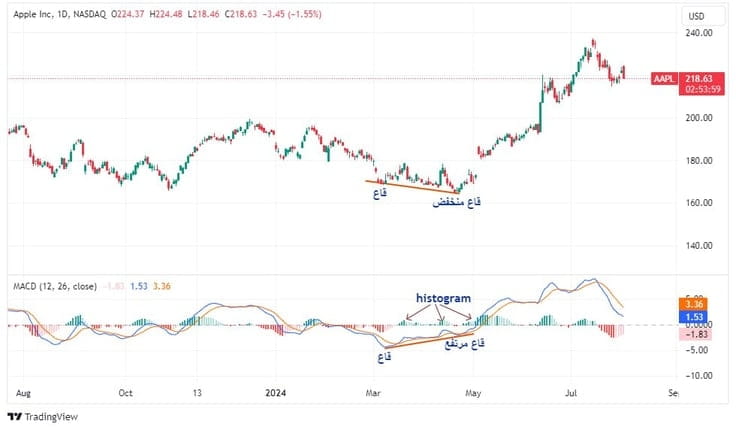
An example of using MACD in positive divergence to generate a buy signal, assuming we saw on the
The chart for Apple stock (AAPL) shows that the price formed a lower low, but the histogram failed to confirm this low level, indicating that the sellers' strength is weakening and a change in direction is imminent.
Using MACD crossover in the trading strategy
Determine the trend on the chart either by visual inspection as mentioned or by using the Average Directional Index (ADX).
We wait for the MACD line to cross above its nine-day moving average in the case of buying or below it in the case of selling.
The entry point is the day on which the crossover occurred or the day following the crossover.
The stop-loss is set at the most recent low (in the case of buying) or above the most recent high (in the case of selling).
Exit when the MACD line crosses below its nine-day moving average in the case of buying or above it in the case of selling.
Bollinger Bands Strategy
The Bollinger Bands indicator is a directional indicator and is one of the known indicators in swing trading. It helps swing traders identify potential price reversals. You can buy near the lower Bollinger Band and sell near the upper band.
Bollinger Bands are lagging indicators and cannot be used to predict prices as they rely on the simple moving average.
Tips for selecting suitable indicators for swing trading
Swing trading indicators are characterized by a high degree of plurality and diversity, as shown in the previous paragraphs. Therefore, it was necessary to find specific criteria based on which the most suitable and best among those indicators can be determined according to the needs of each trader.
Basic criteria for selecting indicators
The swing trader using technical analysis needs to read price movements and use indicators, both of which are equally important.
First: Choose the right indicator for the right market
Indicators can be divided into two main types: directional indicators and non-directional indicators.
Trending Indicators: These are designed to indicate fundamental changes in direction. They measure the strength of trends and indicate their reversal and should be used in assets that move continuously either upward or downward.Non-trending Indicators: These measure the strength of buyers or sellers. Non-trending indicators indicate when the price reaches overbought or oversold levels. Non-trending indicators should be used when the price is moving between two levels, that is, within a range.
The problem arises when directional indicators are used in non-directional markets (characterized by price moving within two price levels) as they will give false signals. These indicators incorrectly assume that the price moving towards a support or resistance level is the start of a new trend, while in reality, these are normal price movements within a range.
Similarly, applying non-directional indicators in directional markets forces prices to revert to the mean. Price reversion does not occur in trending markets.
Second: Do not use more than 3 indicators
The more indicators you add, the more likely the indicators are to fail to provide consistent signals. Rarely do all indicators point to the same direction, as all indicators depend on price, volume, or both. When you use 5 or 6 indicators on a single chart, you amplify the information, making it difficult to interpret them all, and you end up not trading.
Thirdly: Use indicators that indicate divergence
Divergences are the strongest signals in technical analysis, as John Murphy says, representing low-risk entry points. Divergences do not always lead to profitable outcomes, but they are more accurate than most signals generated by indicators. Divergence occurs when prices move in one direction while the indicator moves in another direction, as we noted in the example with natural gas. The Stochastic indicator and the Relative Strength Index (RSI) can be used.
Customizing indicators based on trading style and goals
Trading styles vary among traders; some seek low-risk, low-profit trades, while others look for high-risk, high-profit trades. Choosing the type of trade and potential risks depends on your trading style, experience, financial goals, and risk tolerance.
The benefits of swing trading indicators can be summarized as they are a supportive means for the approach followed by any trader, meaning that you can use the same indicators to identify trends and momentum, but the difference lies in the timeframe used and determining entry and exit points from the trade. For example, benefiting from the same indicator in swing trading or day trading, while the real difference is in the trading plan itself.
Conclusion
Managing emotions is the hardest part of swing trading. The better you become at trading, the more your emotions tend to lead you to abandon the rules that got you to where you are. However, emotions can be managed. You can limit their impact by using a stop-loss (for example) to limit losses when the price moves against the direction you want, and swing trading indicators help you determine the best time to enter and exit.
As a swing trader, you must maintain your intellectual curiosity and stay continuously informed about new investment tools including indicators to continue improving your performance.